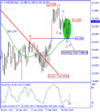
GBP/USD since 09.07.2013 till now was in a strong and consistent uptrend that buyers were successful in achieving the highest price of 1.68168. During this price uptrend, the price has been stopped from more ascending by reaching to the area of important Resistance Zone made of 5 peak prices date back to 2009(also 2011). Right now in daily and h4 time frames, the price is under 5-day moving average that shows the descending trend and warns about more descending. Formation of Dark cloud Cover and Doji candlestick patterns in green area shows indecision market and vulnerability of ascending trend. RSI indicator is in saturation Buy area and with the next cycle confirms the top price of 1.68168 warns about price reformation during the next candles. Generally according to the formed signs until the top price of 1.68168 is preserved, price has the potential of descending.