Technical Analysis of AUD/USD dated 09.04.2015
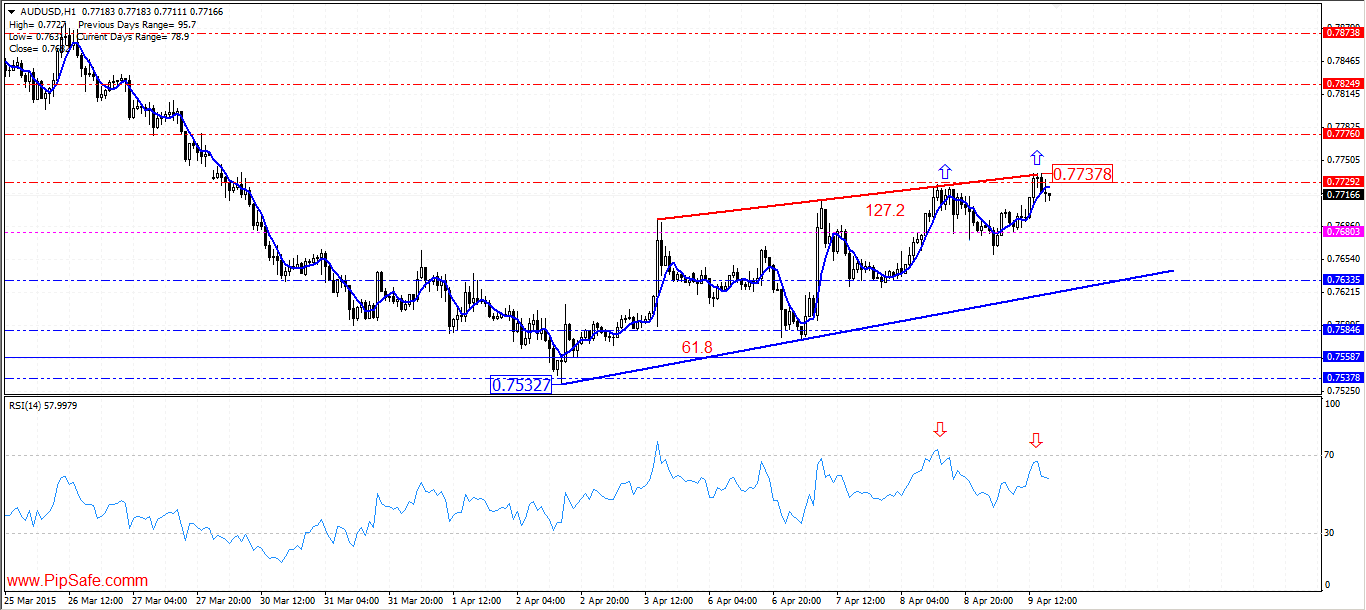
AUD/USD on 02.04.2015 by creating the ideal bottom price (formation of hammer candlestick with candle confirmation) has started to ascend and could record the top price of 0.77378.Right now in daily time frame price is above 5-day moving average and warns the potential of ascending of price during the next days(Long term time) .Price has formed a top price (Evening star pattern) with reaching to the specified resistance levels in the picture below and it has stopped from more ascend and has started a little descend with shows exit of some buyers from their trades.
As it is obvious in the picture below, between the bottom price of 0.75327 and top price of 0.77378 , there is AB=CD harmonic pattern with none-ideal ratios of 61.8 and 127.2 that with completion of the D point , there is a warning for stopping of uptrend and changing price direction.RSI indicator is in saturation buy area and in divergence mode with the price chart confirms the mentioned top price and warns about changing price direction.The first important warning for ascending of price is breaking of the 0.77378 resistance level(R1 of Pivot Point or D point).