Daily Technical Analysis by PipSafe

Technical analysis of GBP/CAD dated 25.02.2015

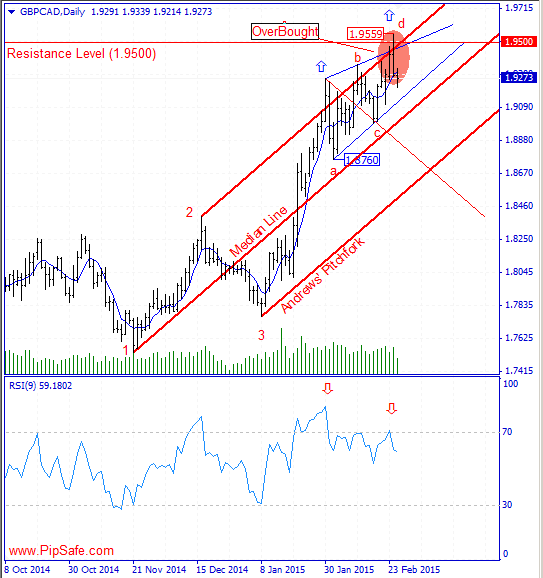
GBP/CAD in recent weeks has a strong ascending trend that shows the serious buyers in reaching to their target prices. The price during this ascending trend could record the top price of 1.9559 that is the most important resistance level in front of price.According to the formed movements in daily chart of this currency pair, there is AB=CD harmonic pattern with none-ideal ratios of 61.8 and 127.2 between bottom price of 1.6760 and the top price of 1.9559 that by completion of the D point in this pattern, there is warning for descending of the price and changing price direction.

Formation of the Higher long shadow in the last day candle shows the failure of buyers in reaching to the higher prices. RSI indicator is in saturation buy area and in divergence mode with the price chart in daily time frame that confirms the price level of 1.9559 and warns changing price direction during the next candles.Generally according to the formed signs in this price chart, until the top price of 1.9559 is preserved, there will be the potential for descending and price reformation in this currency pair.

GBPCAD.png
 
Technical analysis of Silver dated 26.02.2015

Silver was in a descending trend from the top price of 18.45 that could record the bottom price of 16.07. Right now this bottom price is fixed by the next ascending candles and is the next nearest supportive level. If this supportive level breaks , the price will have the potential of reaching to the important supportive level of 16.00.

As it is obvious in the picture below, there is a harmonic Gartley pattern between the bottom price of 15.52 and the top price of 18.45 that there is a potential for changing price direction from D point of this pattern.Stoch indicator confirms the ascending trend in this time frame and warns its possibility.Currently the first sign for Sellers is breaking of the D point of harmonic pattern in the price chart.

silver.png
 
Technical analysis of EUR/USD dated 27.02.2015

EUR/USD in recent weeks has been in a strong and consistent trend in the price movements which Sellers have been successful in reaching to the lowest price of 1.11830.As it is obvious in the picture below, price during the descending has touched the round supportive level of 1.11000 and has created the hammer candlestick pattern.As it is obvious in the picture below, there is a harmonic Gartley pattern between the bottom price of 1.11830 and the top price of 1.15339 that there is a potential for changing price direction from D point of this pattern.

According to the descending potential in weekly time frame, price reformation of 4H time frame is not stable and by breaking the support level of d point, the ascending signal for 4H time frame will be invalid.RSI indicator in 4H time frame is in saturation sell area of the D point confirms AB=CD harmonic pattern and and with the next cycle warns about ascending of price during the next candles. According to the current selling in the EUR/USD price the first warning for ascending of price is breaking of the resistance level of 1.12460.


Untitled11.png
 
Technical analysis of GBP/AUD dated 06.03.2015

As it was mentioned in the previous analysis of this currency pair dated 16.02.2015, according to the formed signs in this price chart, there was the possibility of descending of price which finally happened.As it is obvious in the picture below, price with reaching to the supportive edge of Down channel has been stopped from more descend and by forming a bottom price (Doji Pattern) of 1.9453 has prepared the field for ascending of price.

AS it is obvious in the picture below, there is an ideal AB=CD harmonic pattern between the top price of 2.0028 and the bottom price of 1.9453 with ratios of 78.6 and 127.2 that warns the ascending of price from the D point.RSI indicator is in saturation sell area that confirms the current harmonic pattern with the next cycle but because of non-compliance and coordination with larger time frames, this signal is not much valid.Based on current chart , there is a probability for bullish candles , First notice for starting bearish trend will be came out after punching D spot in 1.9453 level.


GBP-AUD.png
 
Technical analysis of EUR/USD dated 2015.03.09

EUR/USD was in a strong and consistent downtrend during the recent months that Sellers were successful in obtaining the lowest price of 1.08240.In 4H time frame, according to the recent movement price, there is a Morning star candlestick pattern (with 3 stars) that warns about formation of a bottom price in this area and ascending of the price.

According to the formed price movement, there is Crab harmonic pattern between the bottom price of 1.08240 and top price of 1.15324 that warns about changing price direction from the D point of this pattern.RSI indicator is in saturation sell area and confirms the harmonic D point and potential for ascending of the price.One of the important warnings for ascending of the price is formation of the candlestick pattern in daily time frame or closing of a ascending candle which prepares the field for ascending of the price .

EURUSD-News.png
 
Technical analysis of GBP/JPY dated 13.03.2015

GBP/JPY with formation of the top price of 184.996 has started to descend and Sellers were successful in achieving the lower price of 180.185.Currently price in weekly , daily and H4 time frames is under 5-day moving average that shows a consistent descending trend with the potential of more downfalls in long period of time.

Price is going toward the support level of 180.000 (the important psychic level of Sellers) and there is not any clear reason of buy signal in long term time frames such as weekly and daily.As it is obvious in the picture below, according to the formed movements in H4 time frame, there is AB=CD harmonic pattern that the D (formation of a bottom price) point of this pattern is the first warning for a price Increase.

Untitled.png
 
Technical analysis of EUR/CAD dated 16.03.2015

EUR/CAD was in a strong and consistent downtrend during the recent days that Sellers were successful in obtaining the lowest price of 1.3388.Price has been stopped from more descending with reaching to the supportive edge of Down channel technical pattern and also the supportive round level of 1.3400 (Sellers use this lever to exit their trades) and starts to ascend.

As it is obvious in the picture below, between the top price of 1.4641 and bottom price of 1.3388 there is AB=CD harmonic pattern with ratios of 78.6 and 127.2 that warns the potential of ascending from the D point of this pattern.RSI indicator in Daily time frame is in saturation sell area and with the next cycle warns about ascending of price during the next candles.Generally according to the current situation, until the bottom price of 1.3388 is preserved, there is the potential for ascending of price and reformation of descending trend.


EURCAD-DAILY.png
 
Technical analysis of EUR/CAD dated 17.03.2015

EUR/NZD was in a strong and consistent downtrend during the recent months that Sellers were successful in obtaining the lowest price of 1.4251. According to the previous day changes, previous week candle was closed as Tweezers Bottom(with hammer pattern) candlestick pattern which shows vulnerability of descending trend and potential for formation of a bottom price in this range.As it is obvious in the picture below, between the top price of 1.6194 and bottom price of 1.4251 there is AB=CD harmonic pattern with ratios of 76.8 and 127.2 that warns the potential of ascending from the D point of this pattern.

RSI indicator is in saturation Sell area in daily time frame and in divergence mode with the price chart that warns about changing price direction during the next days.Generally according to the current situation, until the bottom price of 1.4251 is preserved, there is the potential for ascending of price and reformation of descending trend.

EURNZD-Analysis.png
 
Technical analysis of AUD/USD dated 18.03.2015

AUD/USD during the recent week was in a strong and consistent Downtrend that Sellers were successful in achieving the lowest price of 0.75602. As it is obvious in the picture below, there is an ideal Gartley harmonic pattern between the top price of 0.77311 and the bottom price of 0.75902 that there is a potential for ceasing of price from D point of this pattern.

Stoch indicator is in saturation Sell area and it is in divergence mode with the price chart that warns the potential for changing price direction. Generally according to the formed sign in the price chart until the bottom price of 1.75602 is preserved, the price has the potential for ascending in this currency pair and the first warning for ascending of price is breaking of the resistance level of 0.76417.

AUDUSD.png
 
Technical analysis of EUR/NZD dated 2015.03.24

EUR/NZD during the recent week was in a strong downtrend that Sellers were successful in achieving the lowest price of 1.4129 .Right now the price is in the lowest prices in the recorded history and generally in long term interval according to the bottom price of 1.4129 and other factors, it has a good potential for ascending.Currently price at daily time frame has formed Hammer candlestick pattern (To notice this candlestick pattern, there is a need to closure of a descending candle) that shows the first warning signals for the formation of a bottom price.

As it is obvious in the picture below, between the bottom price of 1.4129 and top price of 1.6195, there is an AB=CD harmonic pattern with ideal ratios of 61.8 and 161.8 which warns about ascending of the price from the D point of this pattern.RSI indicator is in saturation sell area and in divergence mode with the price chart confirms the mentioned bottom price and warns about changing price direction.Generally according to the current situation, if the bottom price of 1.4129 records, the price will have the potential in reaching to the S=R .

EURNZD.png
 
Back
Top