Daily Technical Analysis by PipSafe

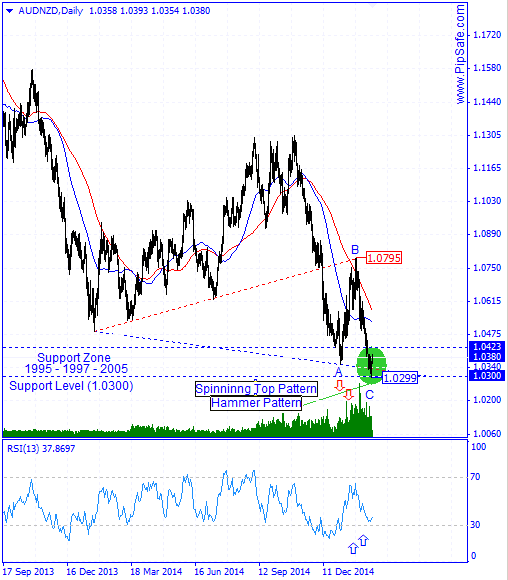
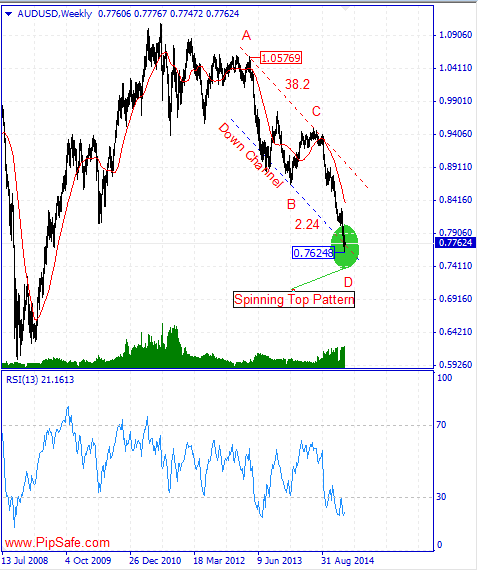
AUD/USD was in a strong and consistent downtrend during the recent weeks that Sellers were successful in obtaining the lowest price of 0.76248. As it is drawn in the picture below, according to the type of price movement, price is in a Down Channel that Sellers use the supportive edge of that to leave their trades.According to the previous week changes, previous week candle was closed as Spinning Top candlestick pattern which shows vulnerability of descending trend and potential for formation of a bottom price in this range.


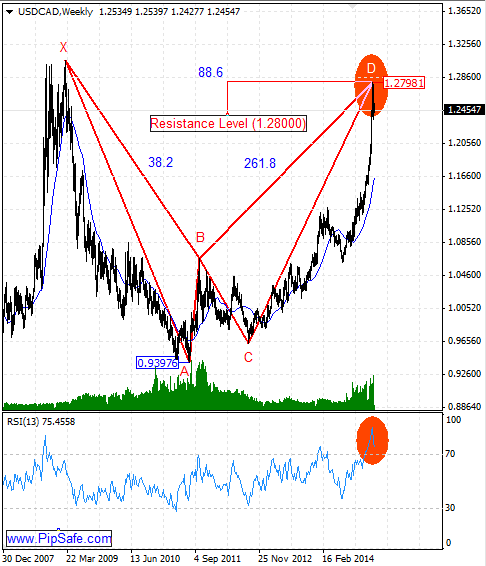
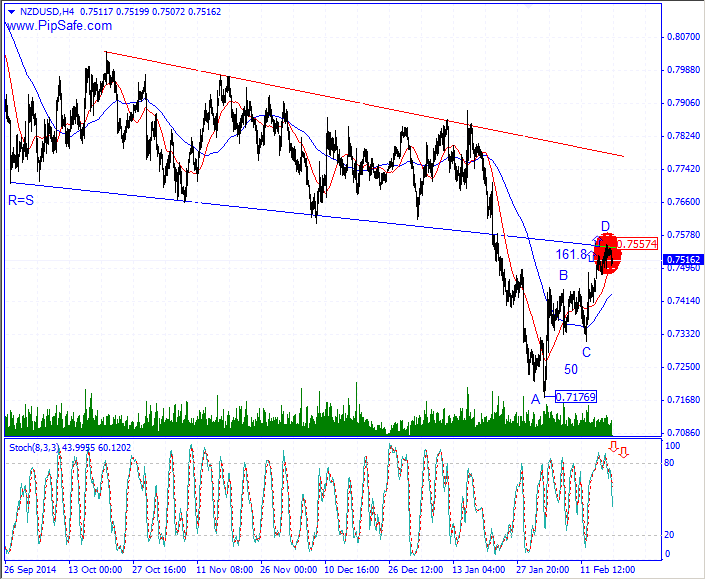
As it is obvious in the picture below, between the top price of 1.05769 and bottom price of 0.76248 there is AB=CD harmonic pattern with ratios of 38.2 and 2.24 that warns the potential of ascending from the D point of this pattern. RSI indicator is in saturation Sell area and confirms the current bottom price, also wars about formation of a Bottom price. Generally until the Bottom price of 0.76248 is preserved, price has the potential of ascending.


Untitled1.png
 
USD/CAD was in a strong and consistent Uptrend during the recent months that Buyers were successful in obtaining the highest price of 1.27981.price with reaching to the important round level of 1.28000 has stopped from more ascend( Buyers used this level to exit their trades) and with formation of a top price in weekly time frame has prepared a field for descending of price.

According to the formation types of price movements on the chart, there is a descending Bat harmonic pattern and by completion of the D point of this pattern, there will be a warning for descending and changing price direction.Generally according to the current situation, until the top price of 1.27981 is preserved, there is the potential for ascending of price and reformation of ascending trend.RSI indicator in weekly time frame is in saturation Buy area and warns the possibility of stopping of the ascending trend by the next cycle.


Untitled2.png
 
Technical analysis of GBP/USD dated 11.02.2015

GBP/USD from the top price of 0.71951 till now was in a downtrend that Sellers were able to achieve the lowest price of 1.49223.One of the sellers’ targets was the round level of 1.50000(and Down Trendline) that they were successful in reaching to it and the price was not able to descend more by reaching to this level. Right now this price level is one of the important supportive levels in front of the price.
According to the recent strong descending, price is in saturation sell area and there is the potential for ascending and price reformation.

Stoch indicator is in saturation sell area and in divergence mode with the price chart in weekly time frame that confirms the price level of 1.49223 and warns changing price direction during the next candles.In the range of formed bottom price there are Spinning Top , Inverted Hammer and Harami candlestick patterns that shows the possibility for formation of a successful bottom price in continuing ascending trend.

Untitled3.png
 
Technical analysis of Gold dated 13.02.2015

Gold was in a strong and consistent downtrend during the recent days that Sellers were successful in obtaining the lowest price of 1216.56.Price has been stopped from more descend with reaching to the specified support level (conversion level r=s) and In the range of formed bottom price there are Inverted hammer and Harami candlestick patterns that shows the possibility for formation of a successful bottom price in continuing ascending trend(need to be confirmed by a bullish candle)

As it is obvious in the picture below, between the top price of 1307.35 and bottom price of 1216.56 there is AB=CD harmonic pattern with ratios of 78.6 and 127.2 that warns the potential of ascending from the D point of this pattern.Stoch indicator is in saturation sell area and confirms the D point of this pattern by the next cycle and warns about the potential of ascending of the price during the next days.Generally until the bottom price of 1216.56 is preserved, there is a potential for ascending and price reformation in this Metal.


Untitled4.png

Fantastic analysis there Pip.Safe. At the beginning of the year I thought that 2015 would be the year that Gold strikes back after last year's decline, but things appear to be becoming very volatile at the moment. However, I still think that at the current levels, now could be an ideal time to buy gold, albeit with a long-term view for profitability. For now, the yellow metal appears to have established support and resistance zones at $1,200-$1,220 and $1,300-$1,320 respectively.
 
GBP/AUD during the recent days was in a strong and consistent uptrend that buyers were successful in achieving the highest price of 2.0030.Price by reaching to the important round resistance level of 2.0000 and the resistance edge of uptrend channel has stopped from more ascend that shows buyers used this price level to exit their trades.

According to the formed price movements in the chart, between the bottom price of 1.7858 and top price of 2.0030,there is AB=CD harmonic pattern with ideal ratios of 61.8 and 161.8 that with completion of the D point there will be a warning for descending of price.Stoch indicator in daily time frame is in the saturation buy area and is in divergence mode with the price chart that warns about changing price direction.One of the important warnings for decreasing of is breaking of supportive level of 1.9768 (Low level of price changes in the previous daily candle).


Untitled5.png
 
Technical analysis of NZD/USD dated 18.02.2015

NZD/USD chart has experienced a strong ascending trend during the recent days that could record the top price of 0.75574.as it is obvious in the picture below , price has been stopped from more ascending with reaching to the Resistance level (S=R) and has formed a top price.

According to the formed movements in the price chart, between the bottom price of 0.71769 and the top price of 0.75574 there is an AB=CD harmonic pattern with the ratios of 50 and 161.8 which the D point of this pattern is completed and warns about descending of the price in this price range.Stoch indicator in 4H time frame is in the saturation buy area and is in divergence mode with the price chart that warns about changing price direction.Right now the first important warning for more ascending of price in this currency pair happens by breaking f the 0.75574 level(D point) in H4 time frame.

Untitled7.png
 
Technical analysis of AUD/SGD dated 19.02.2015

was in a strong and consistent downtrend during the recent months that sellers were successful in obtaining the lowest price of 1.0324.price with reaching to the supportive level which is shown in the picture below ( made of 4 bottom prices) has stopped from more descend( sellers used this level to exit their trades) and with formation of a bottom price in Weekly time frame has prepared a field for ascending of price.According to the previous week changes, previous week candle was closed as Hammer candlestick pattern which shows vulnerability of descending trend and potential for formation of a bottom price in this range.

As it is obvious in the picture below, between the top price of 1.1384 and bottom price of 1.0324 there is AB=CD harmonic pattern with ratios of 50 and 161.8 that warns the potential of ascending from the D point of this pattern.Stoch indicator is in saturation sell area in weekly time frame and in divergence mode with the price chart that warns about changing price direction during the next days.Generally according to the current situation, until the bottom price of 1.0324 is preserved, there is the potential for ascending of price and reformation of descending trend.


Untitled8.png
 
Technical analysis of AUD/NZD dated 20.02.2015

AUD/NZD since 2011 was in a long term and strong downtrend which is currently among the lowest prices. Sellers could achieve the lowest price of 1.0299 during this downtrend.Right now price has been stopped by reaching to the round level of 1.0300 and supportive levels’ range (made of 3 bottom prices dated back to 1995) and by making a bottom price had a little ascend.

formation of hammer candlestick pattern on 19th day in daily time frame, there is a warning for the first failure of sellers in achieving lower prices and formation of a bottom price for increasing of the price in this area.RSI indicator in Daily time frame is in saturation sell area and also in divergence mode with the price chart which confirms the bottom price of 1.0299 and warns about changing price direction.Generally according to the formed signs in price chart until the bottom price of 1.0299 is preserved, price will have the potential for ascending and reformation.

Untitled9.png
 
Technical analysis of EUR/NZD dated 24.02.2015

EUR/NZD was in a strong and consistent downtrend during the recent days that Sellers were successful in obtaining the lowest price of 1.4945.price with reaching to the important round level of 1.5000 has stopped from more descend ( Sellers used this level to exit their trades) and with formation of a bottom price in daily time frame has prepared a field for ascending of price.price in daily time frame created hammer candle stick pattern in bottom price of 1.4945 and has provided ascending of price and stop loss of price.

As it is obvious in the picture below, there is a harmonic Gartley pattern between the bottom price of 1.4945 and the top price of 1.5816 that there is a potential for changing price direction from D point of this pattern.Stoch indicator is in saturation sell area in daily time frame and it warns the potential for ascending of the price according to the next cycle.Generally according to the formed signs in price chart, until the bottom price of 1.4945 is preserved; price will have the potential for increasing and ascend.

EURNZD-Chart.png
 
Back
Top