Admiral Markets
AdmiralMarkets.com Representative
- Messages
- 95
EURUSD breaks bear flag pattern, GU builds bullish zigzag
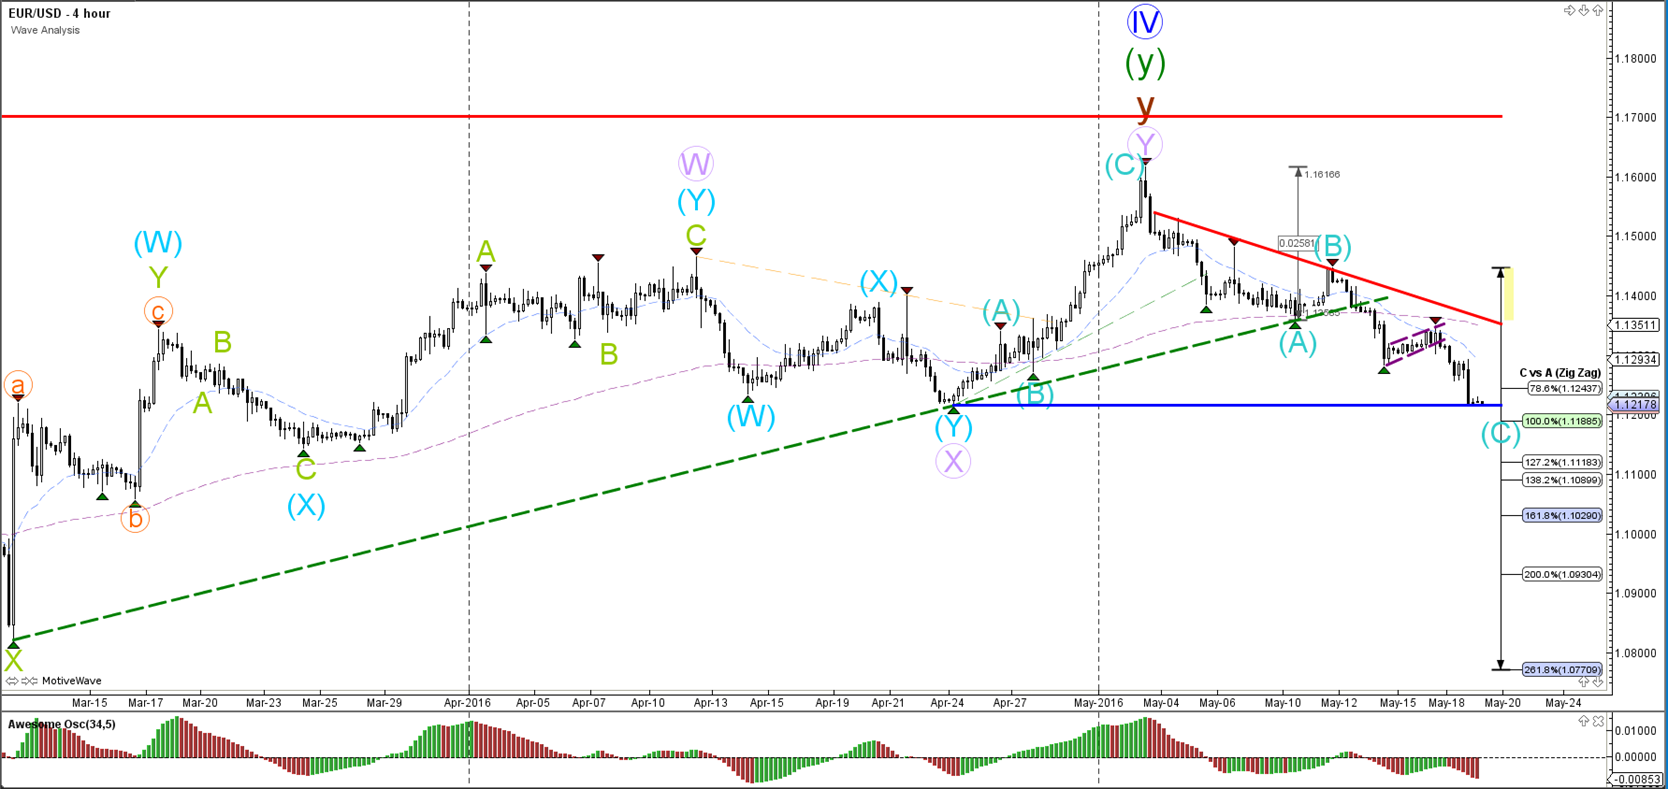
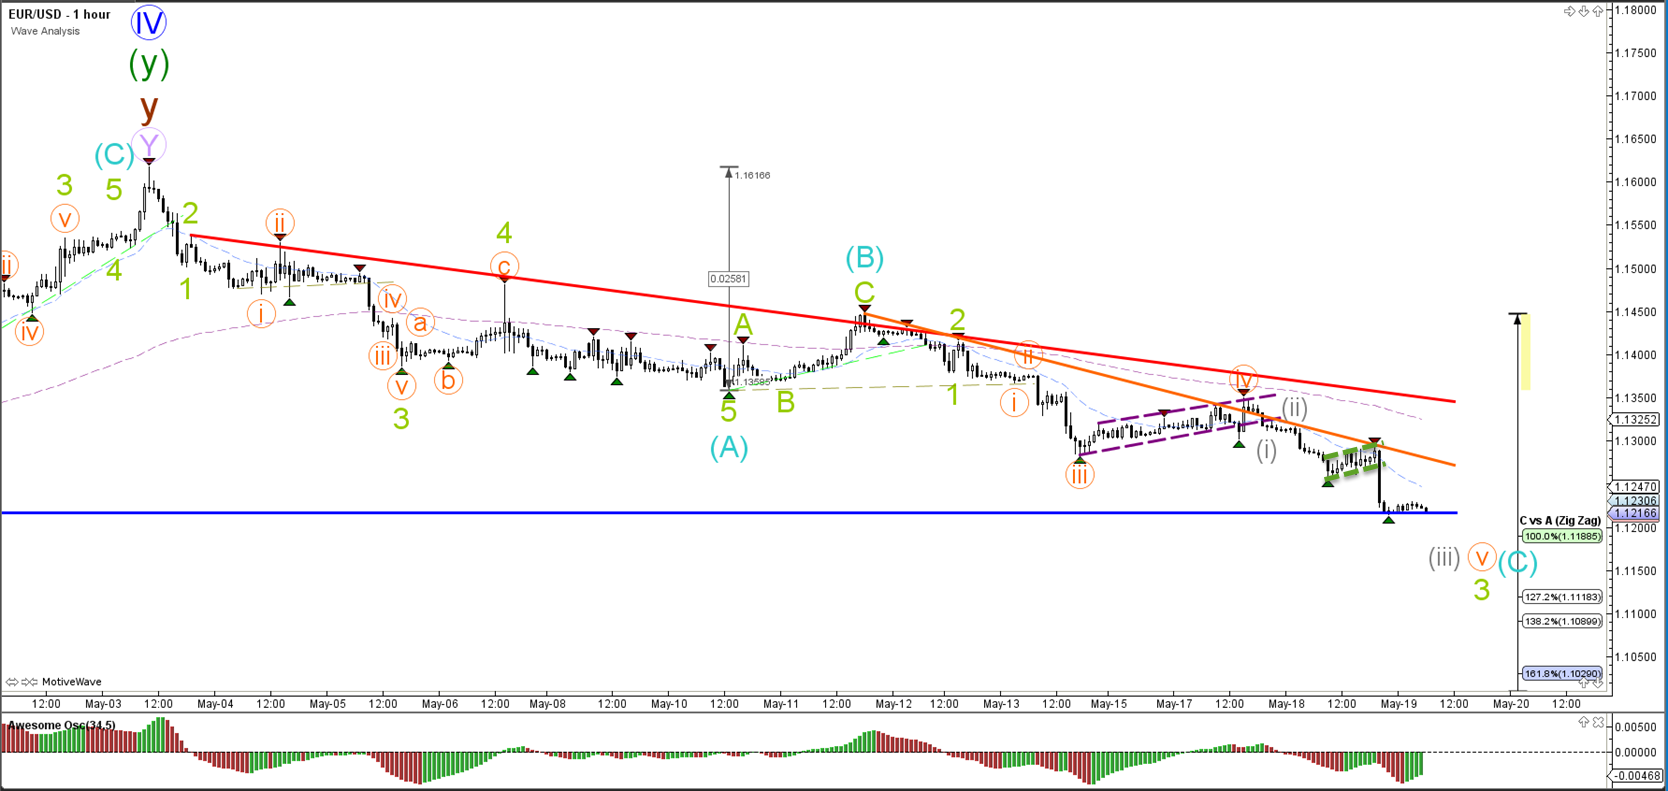
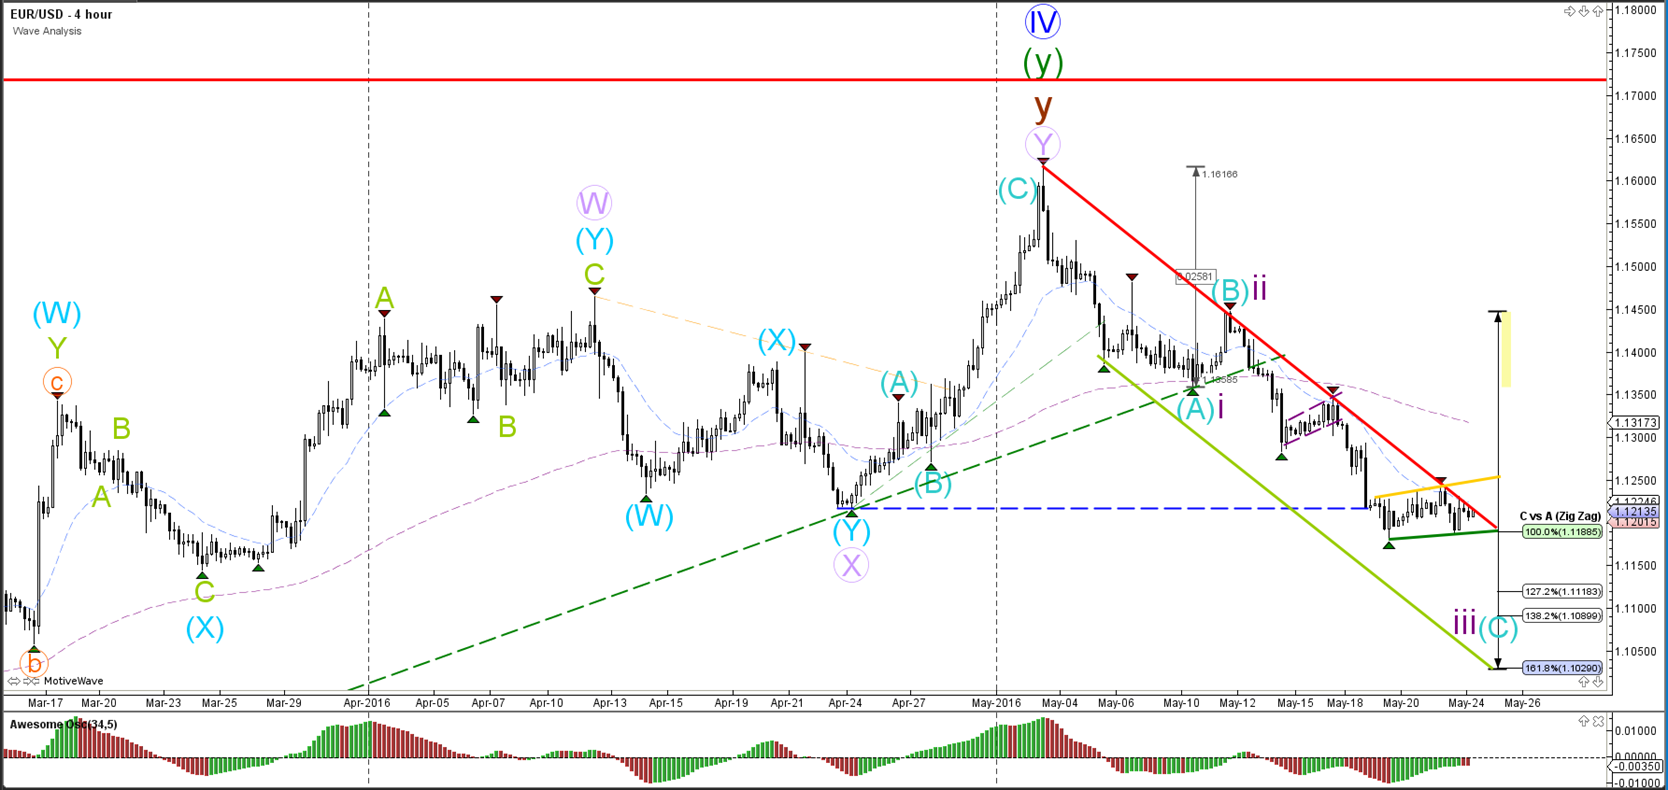
EUR/USD
4 hour
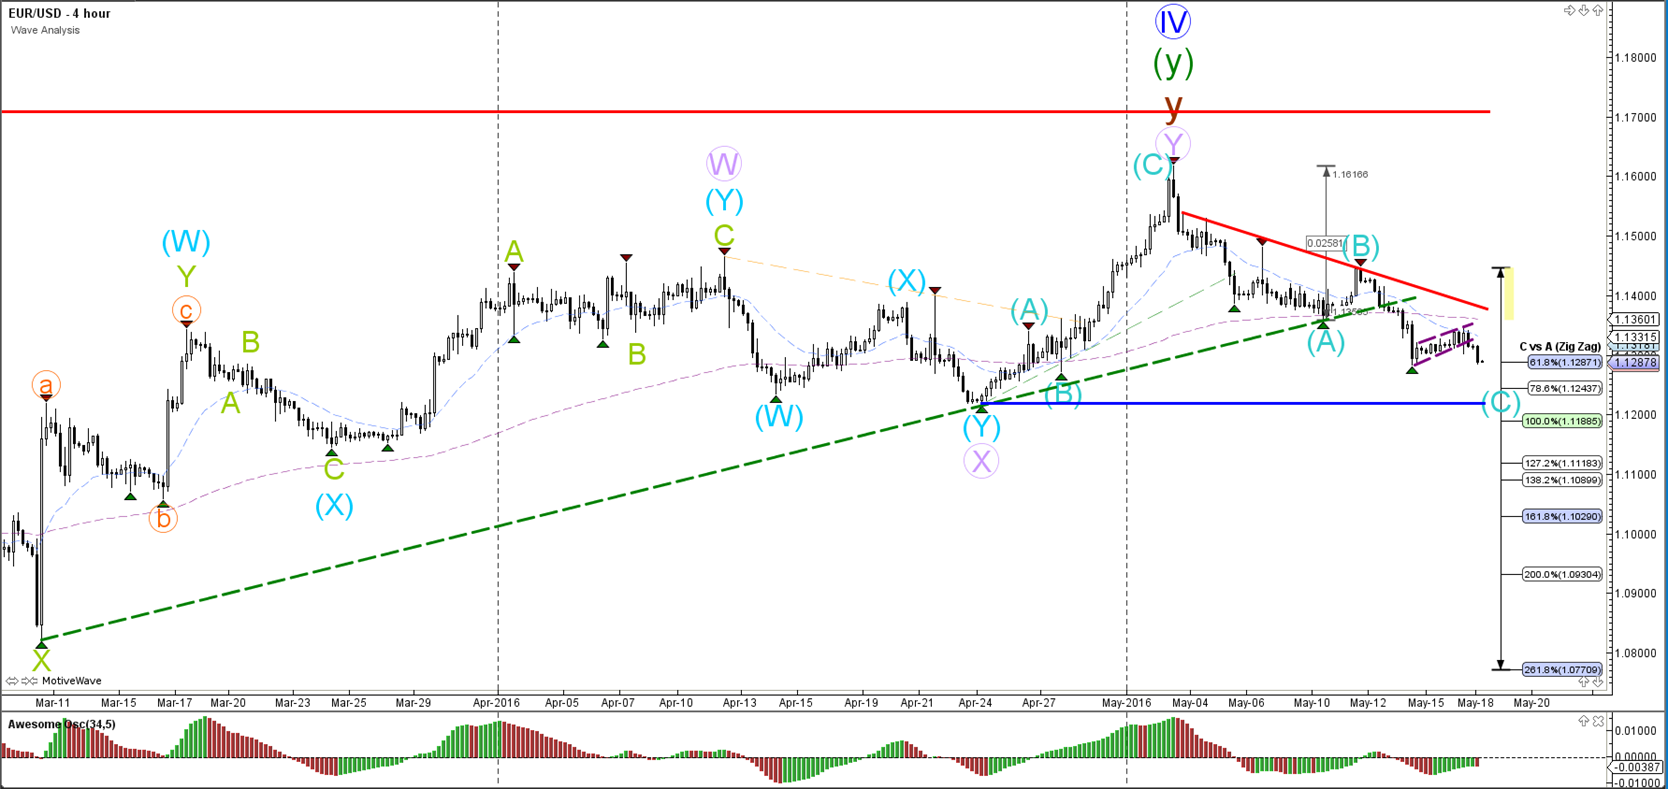
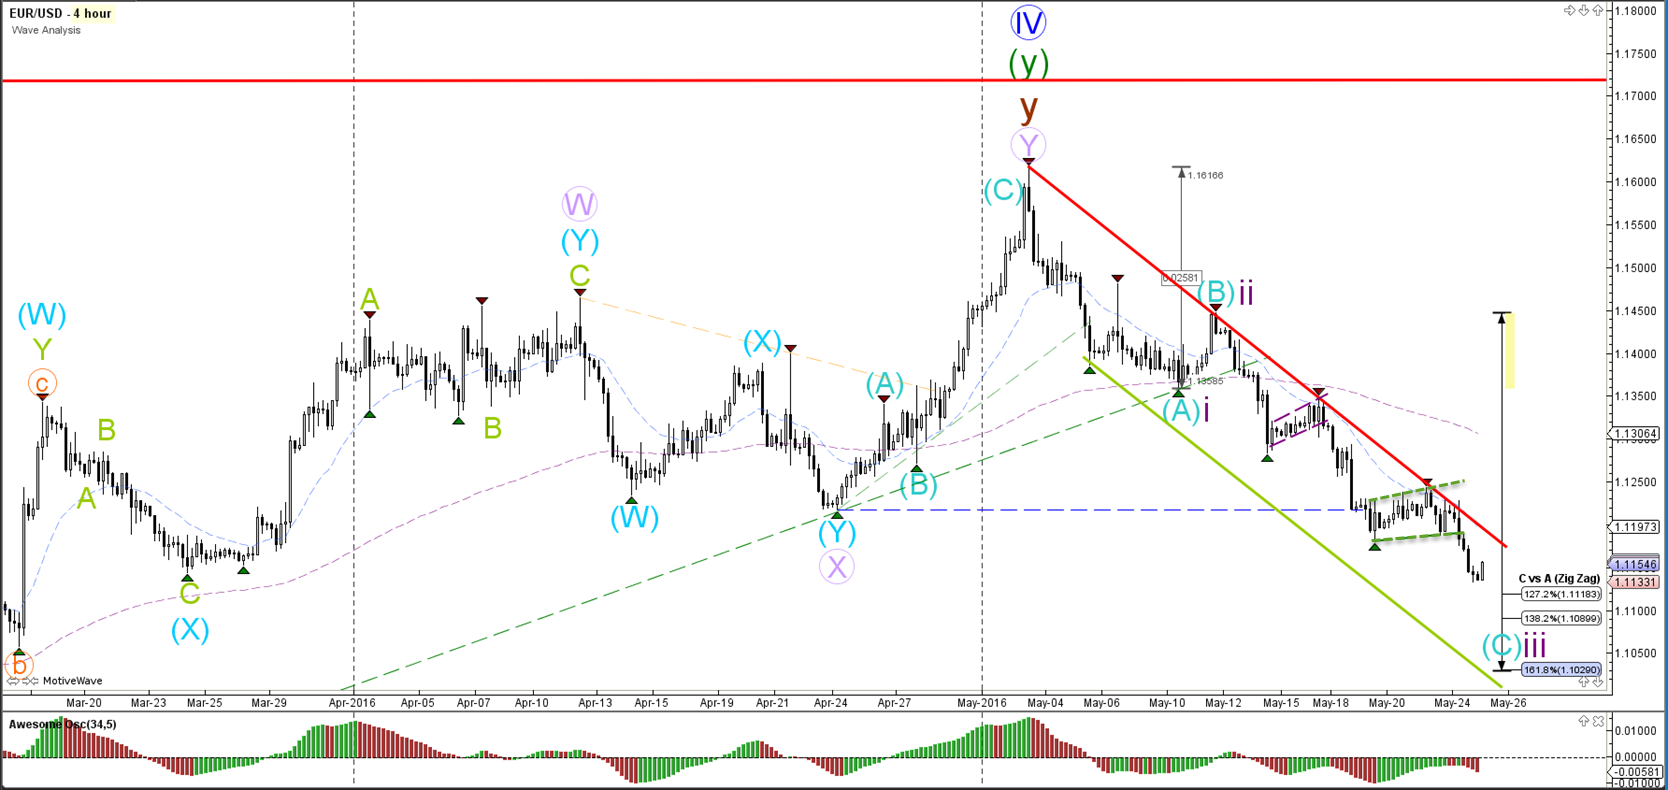
The EUR/USD broke the bear flag chart pattern (dotted purple) as price heads lower to the Fibonacci targets. For the moment the wave count has been labeled as a continuation of wave C (blue). The alternative is a wave 3 if price manages to break below the 161.8% Fibonacci target.
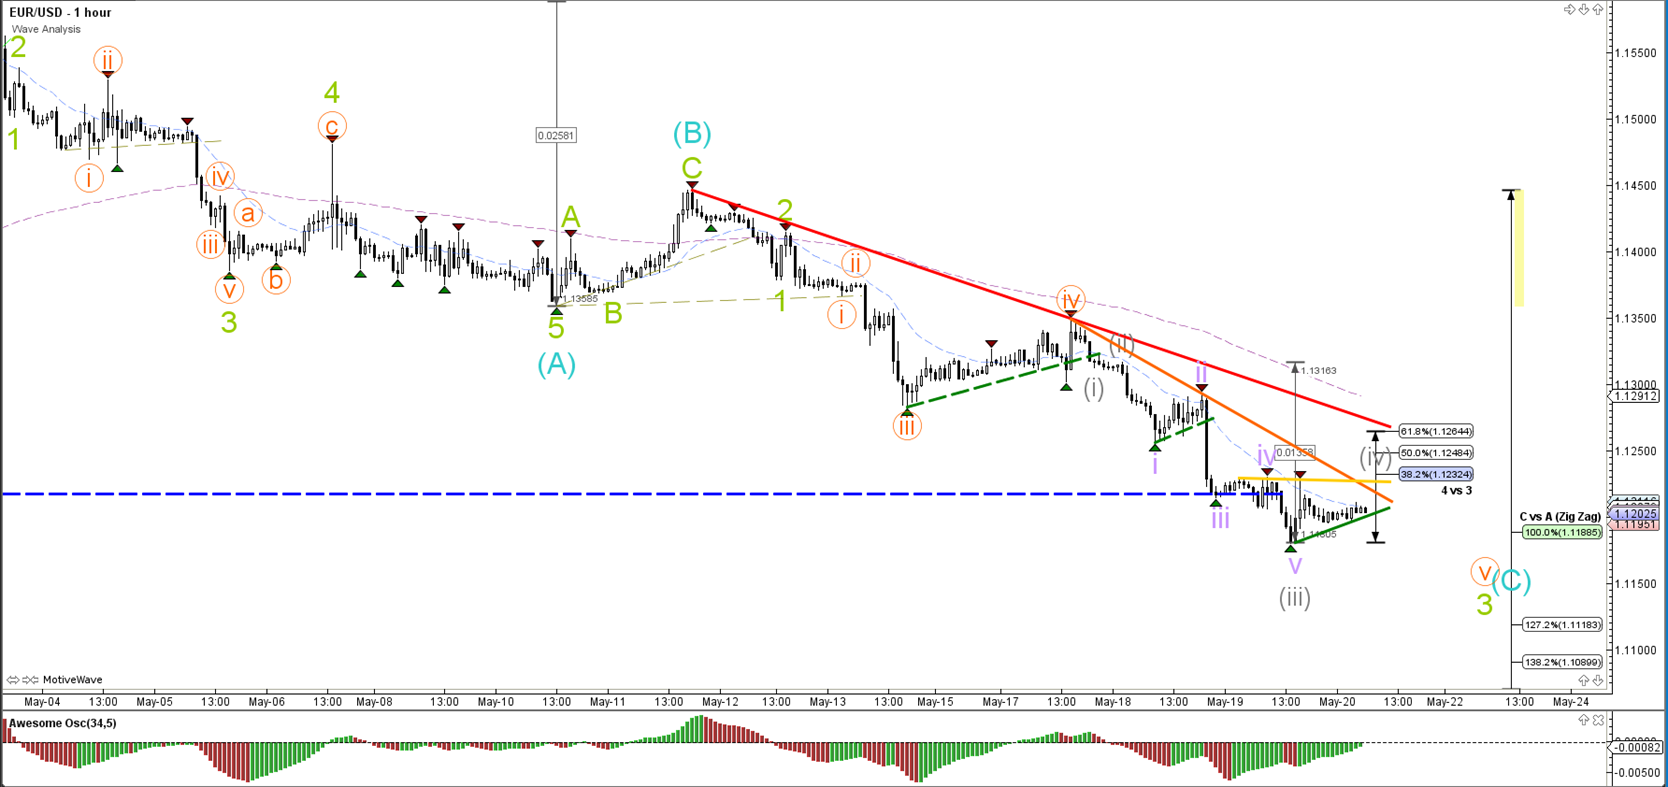
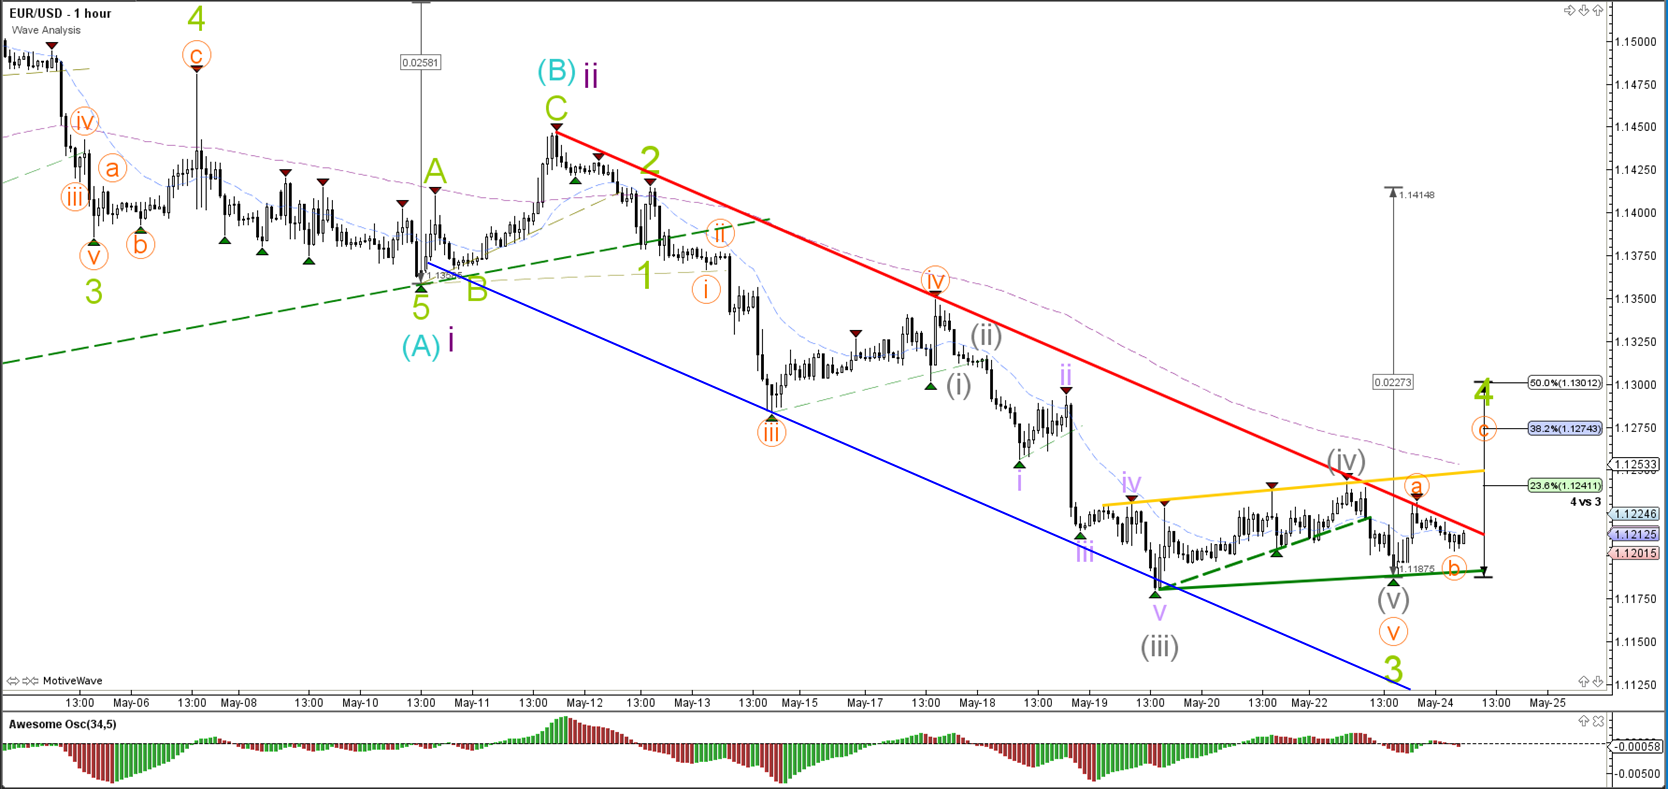
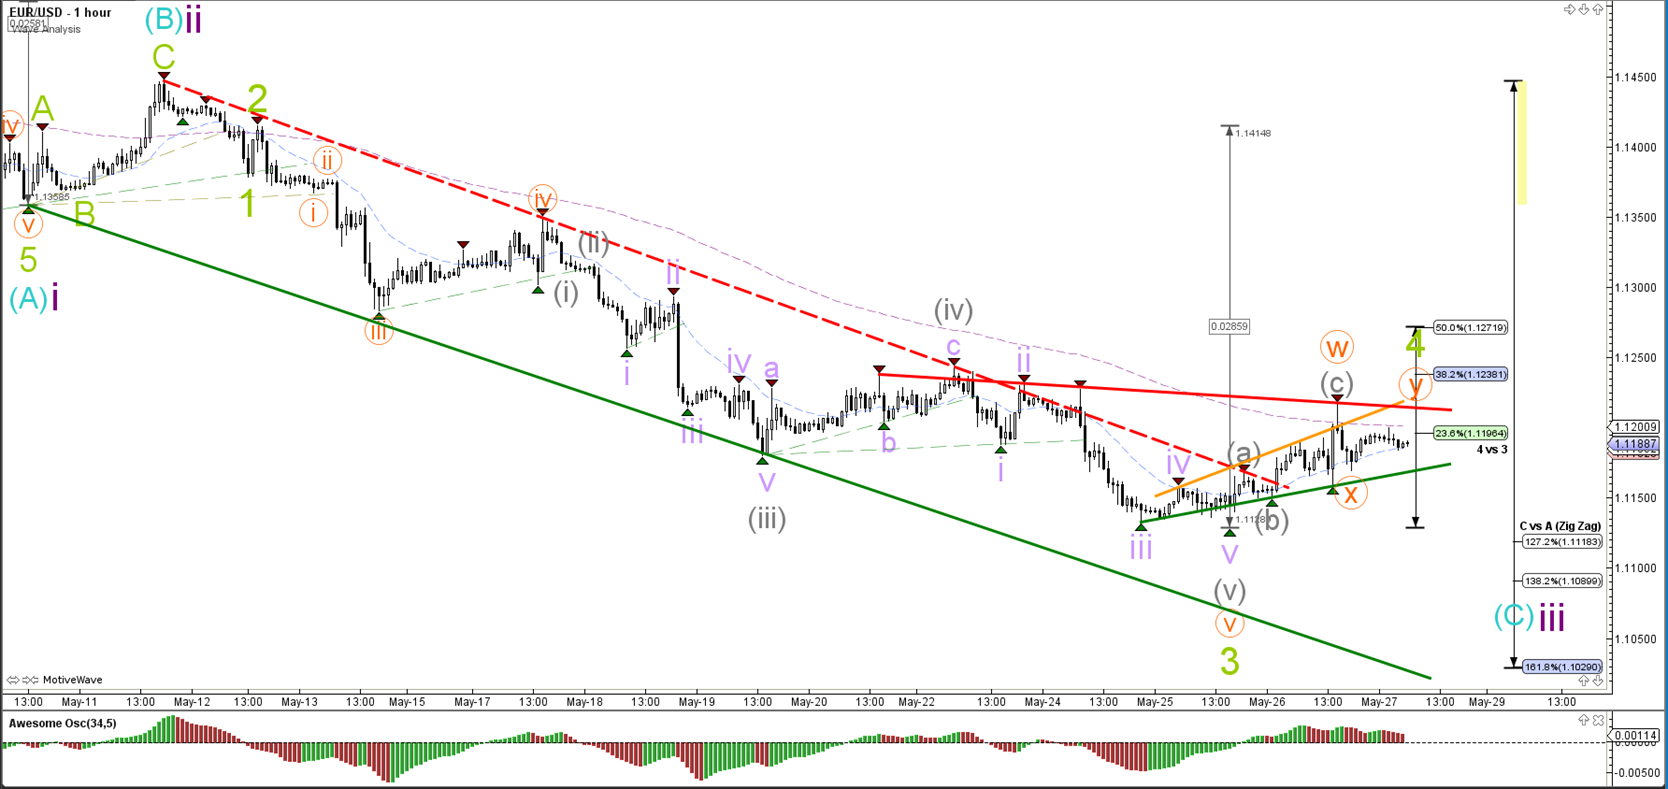
1 hour
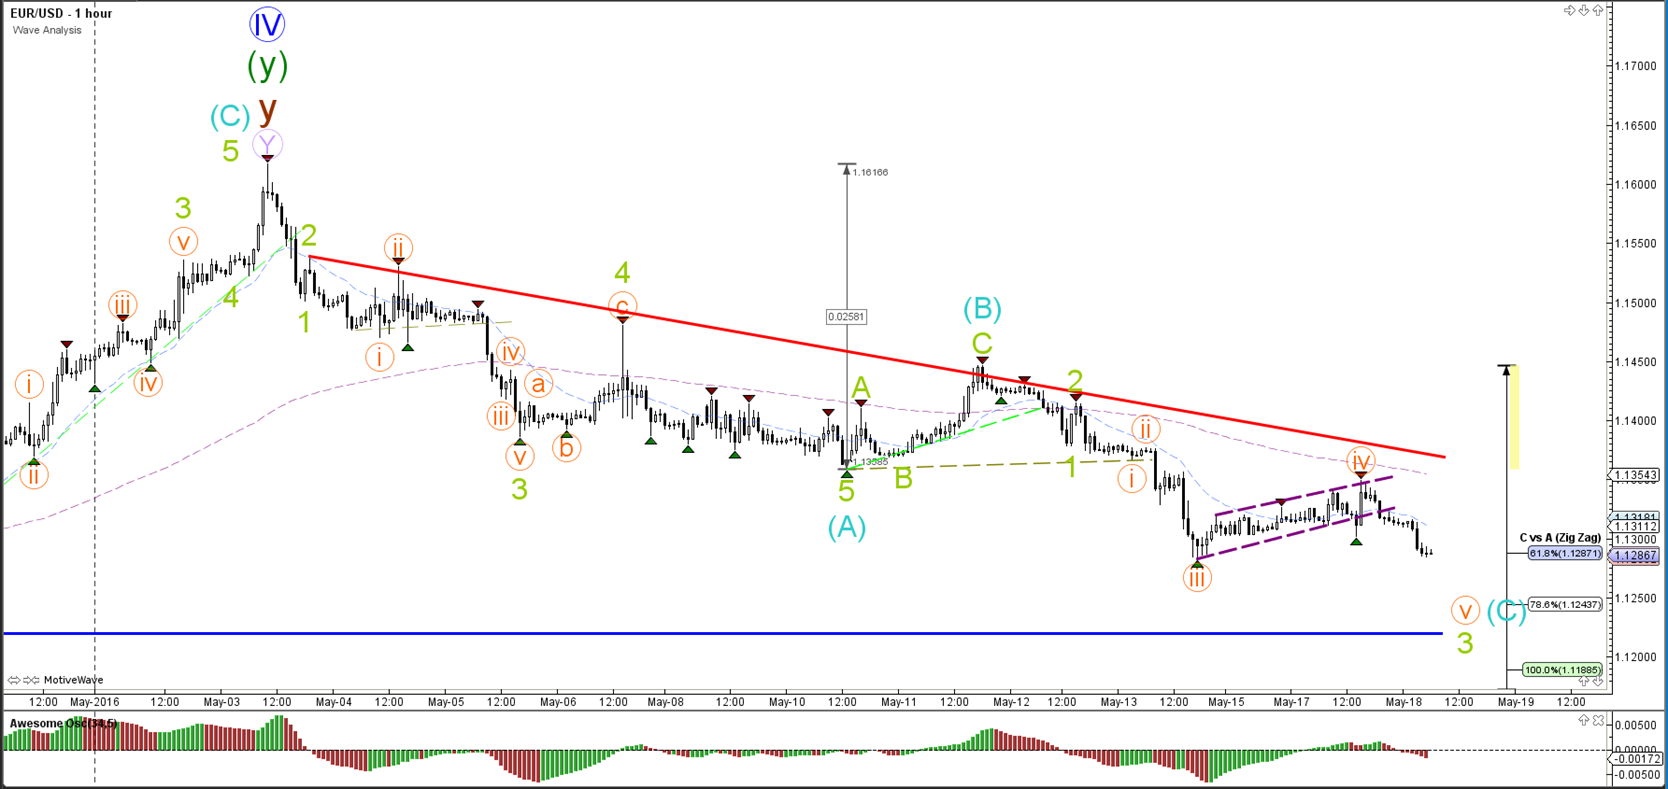
The EUR/USD breaks another support trend line (purple) and is building a decline as part of a wave 5 (orange). The blue line is a strong bottom from the 4 hour chart which could act as a bouncing spot.
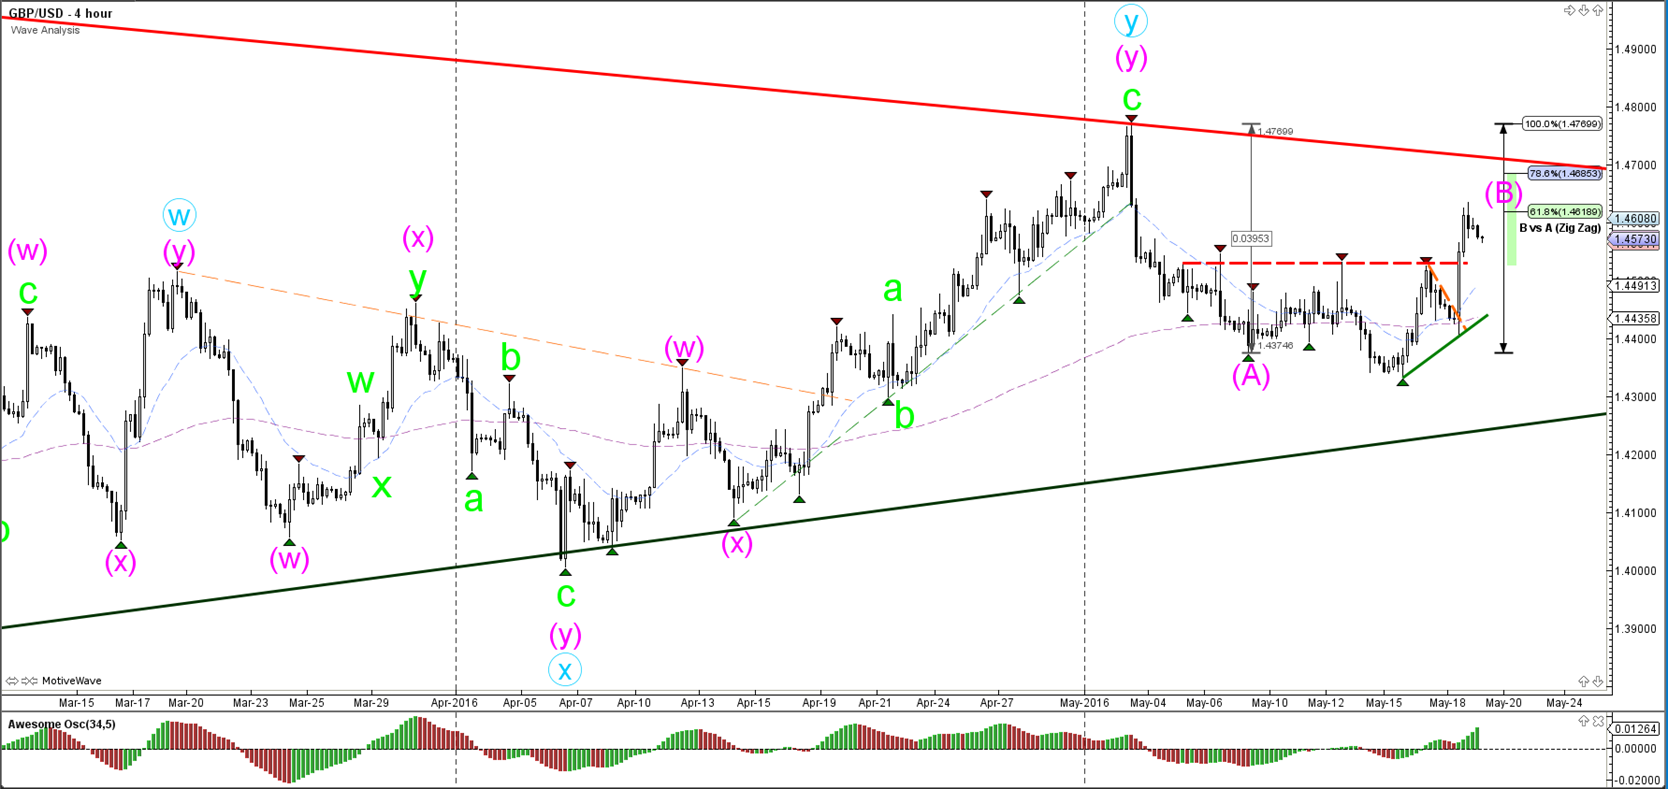
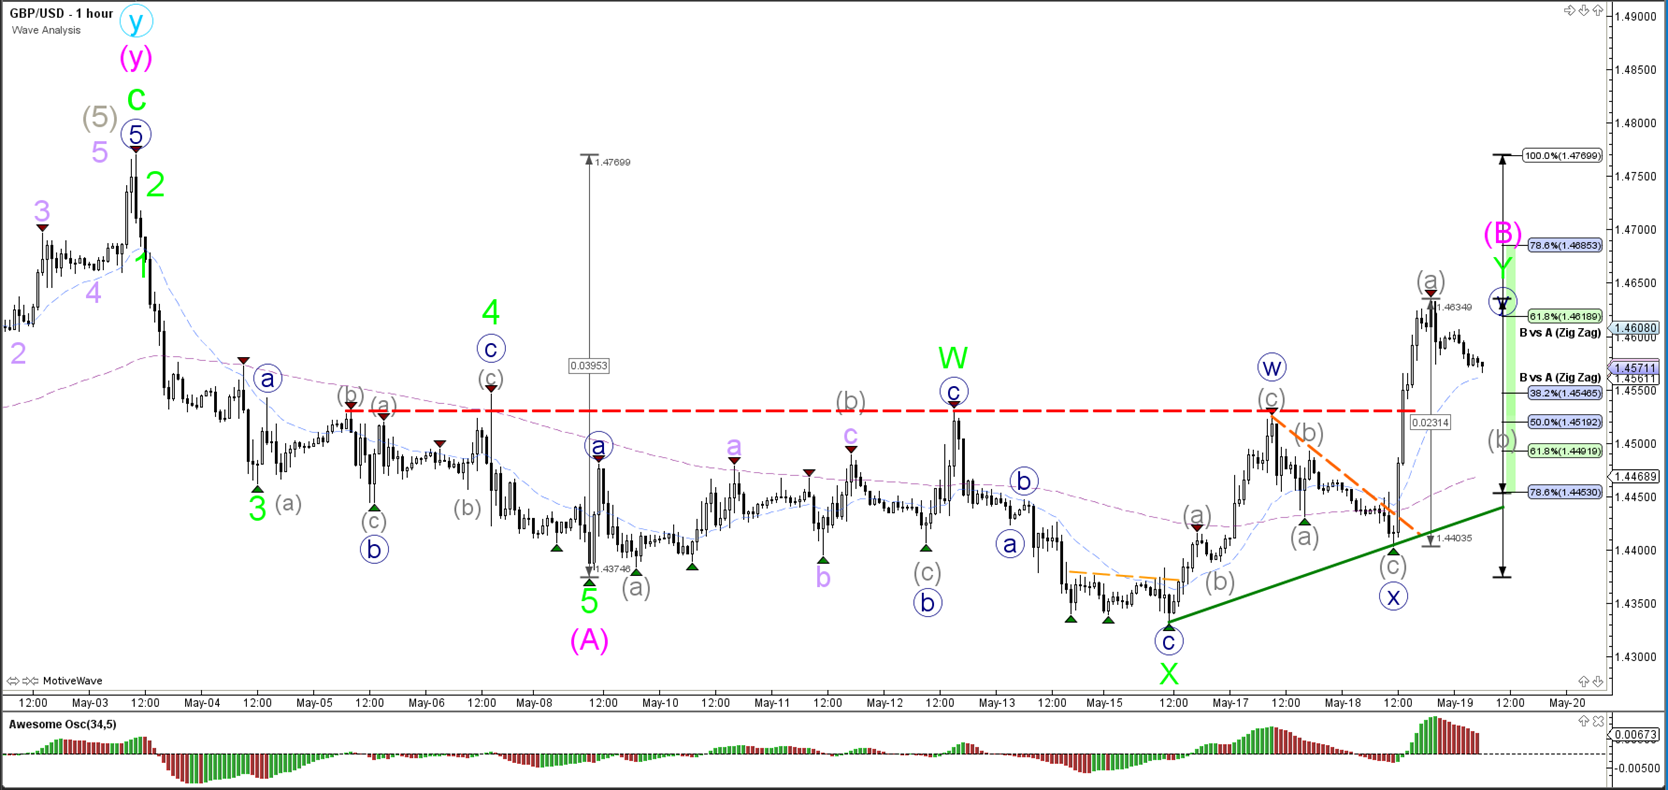
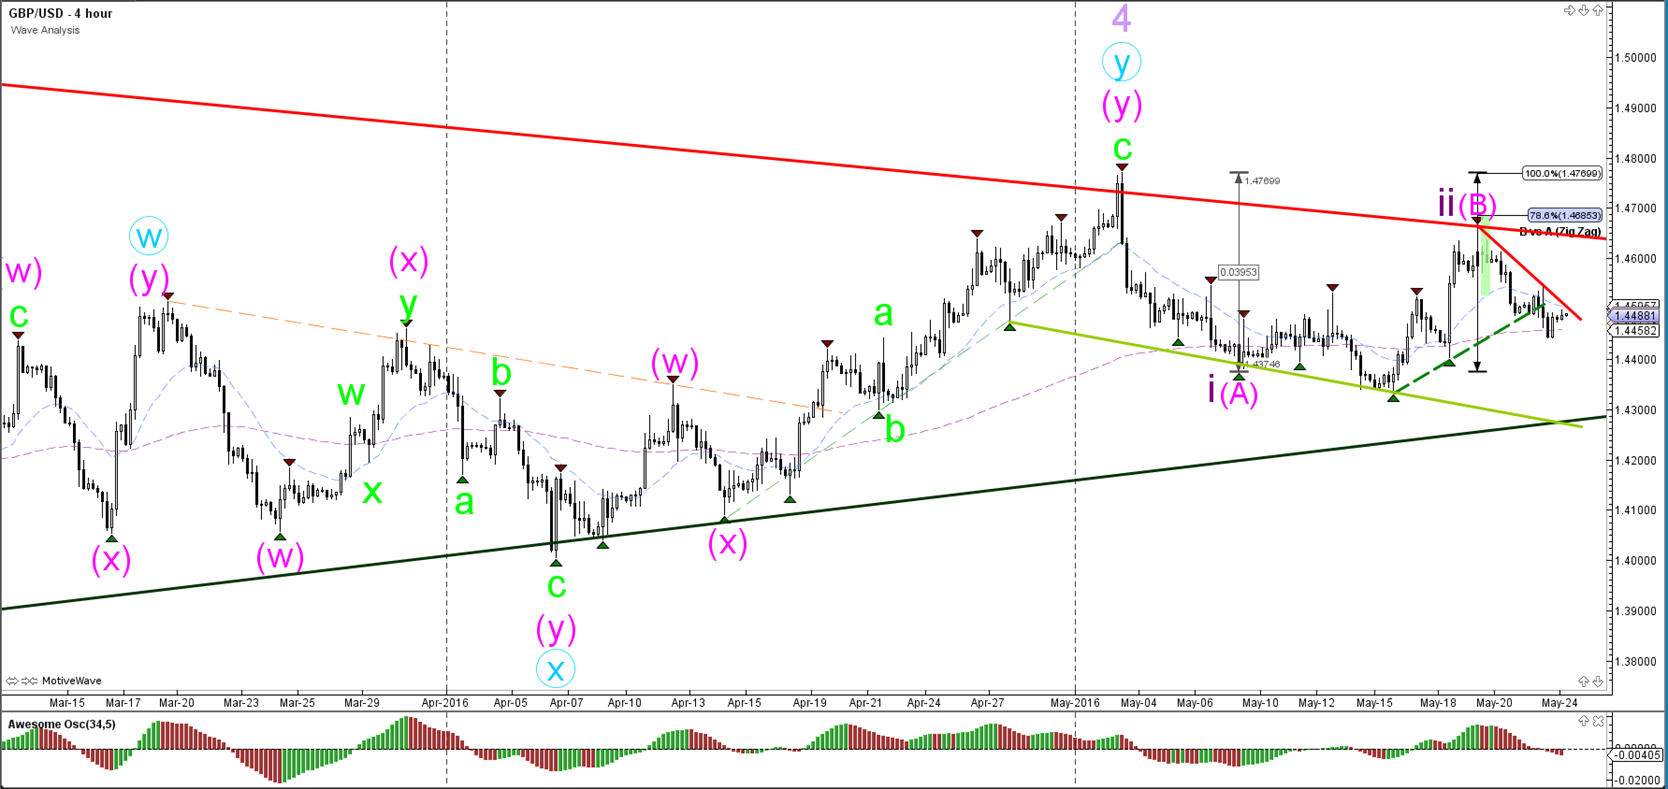
GBP/USD
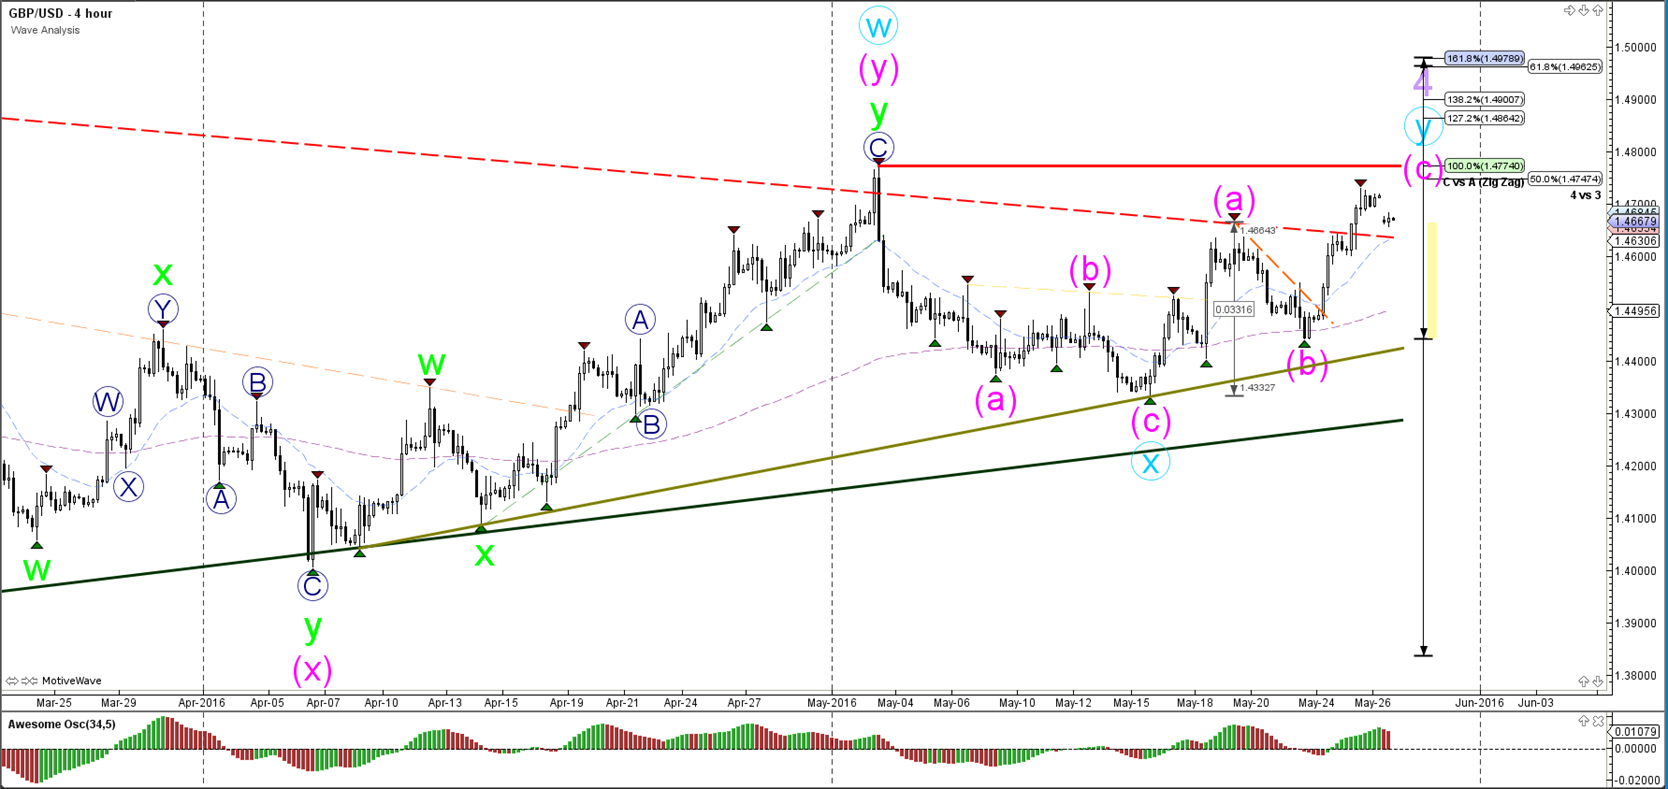
4 hour
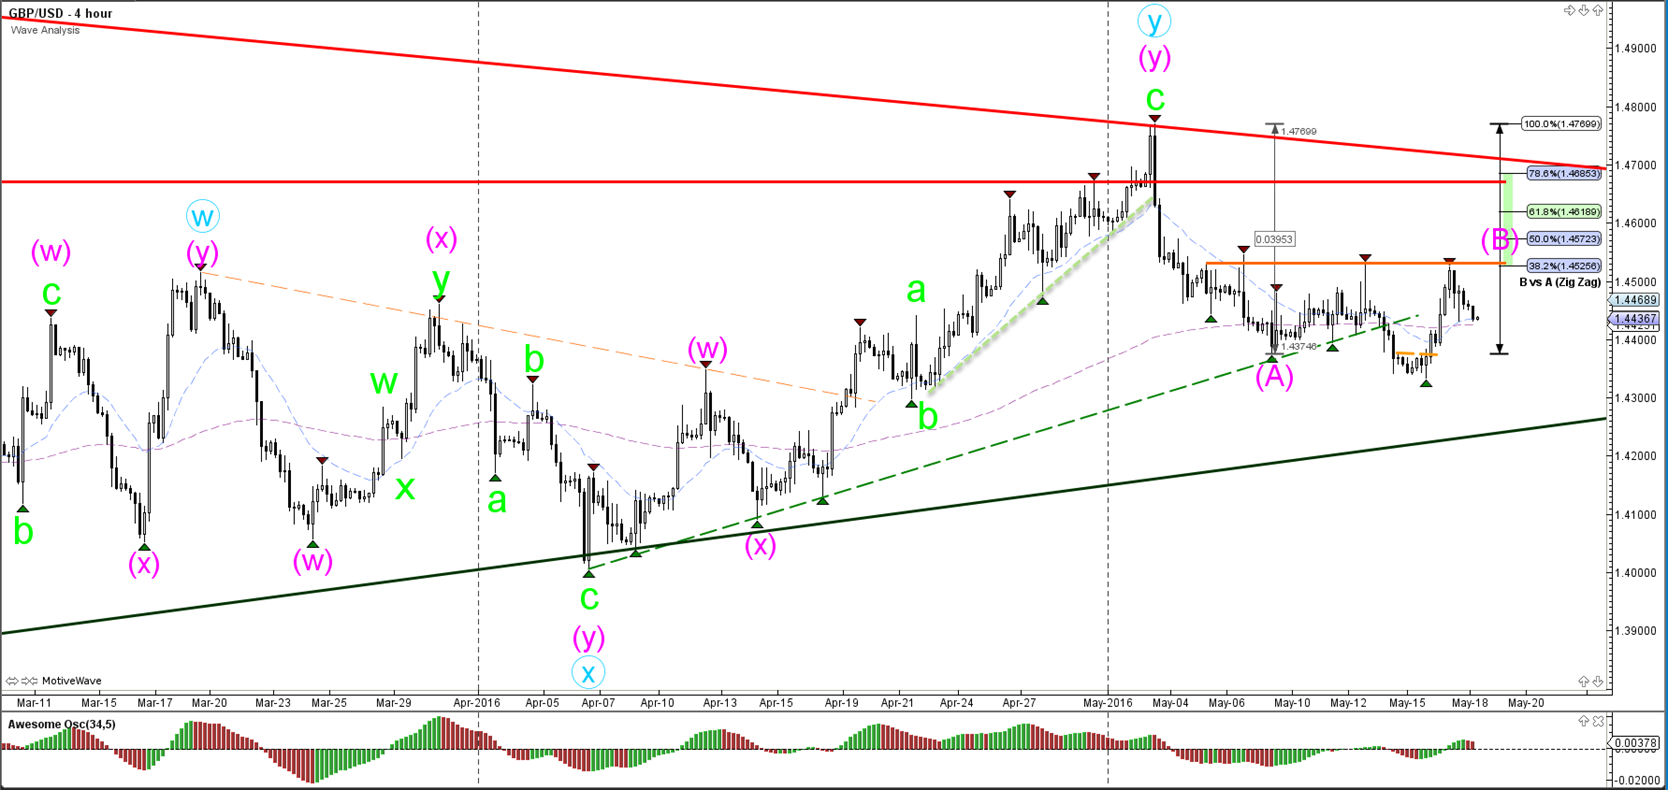
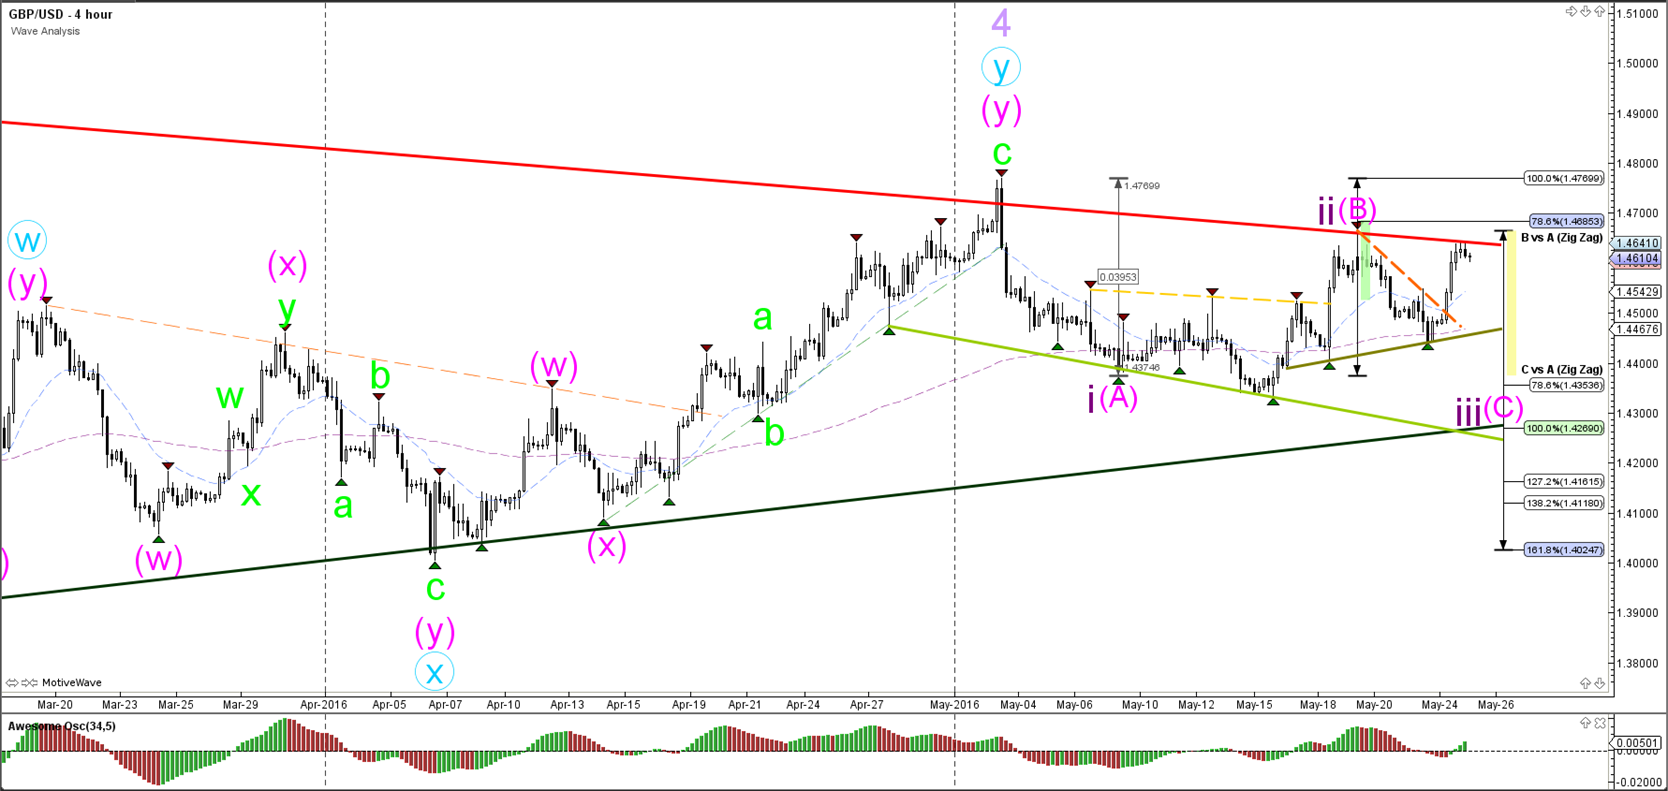
The GBP/USD has respected the resistance level (orange) at the 38.2% Fibonacci level. All of the Fibonacci levels and resistance trend lines offer a strong resistance zone. A break above the 100% Fibonacci level invalidates the current wave count.
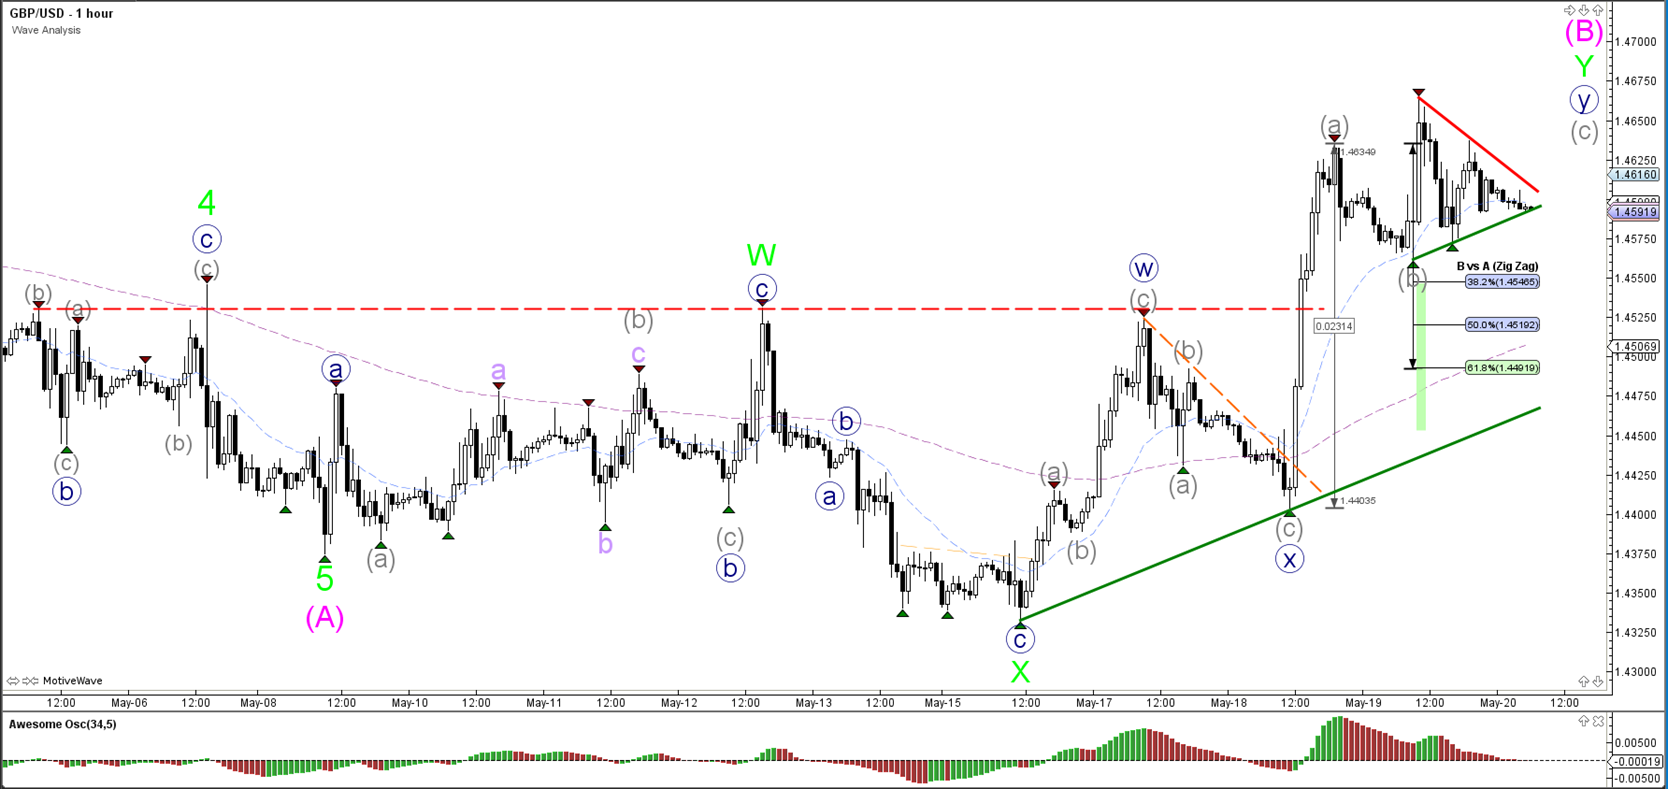
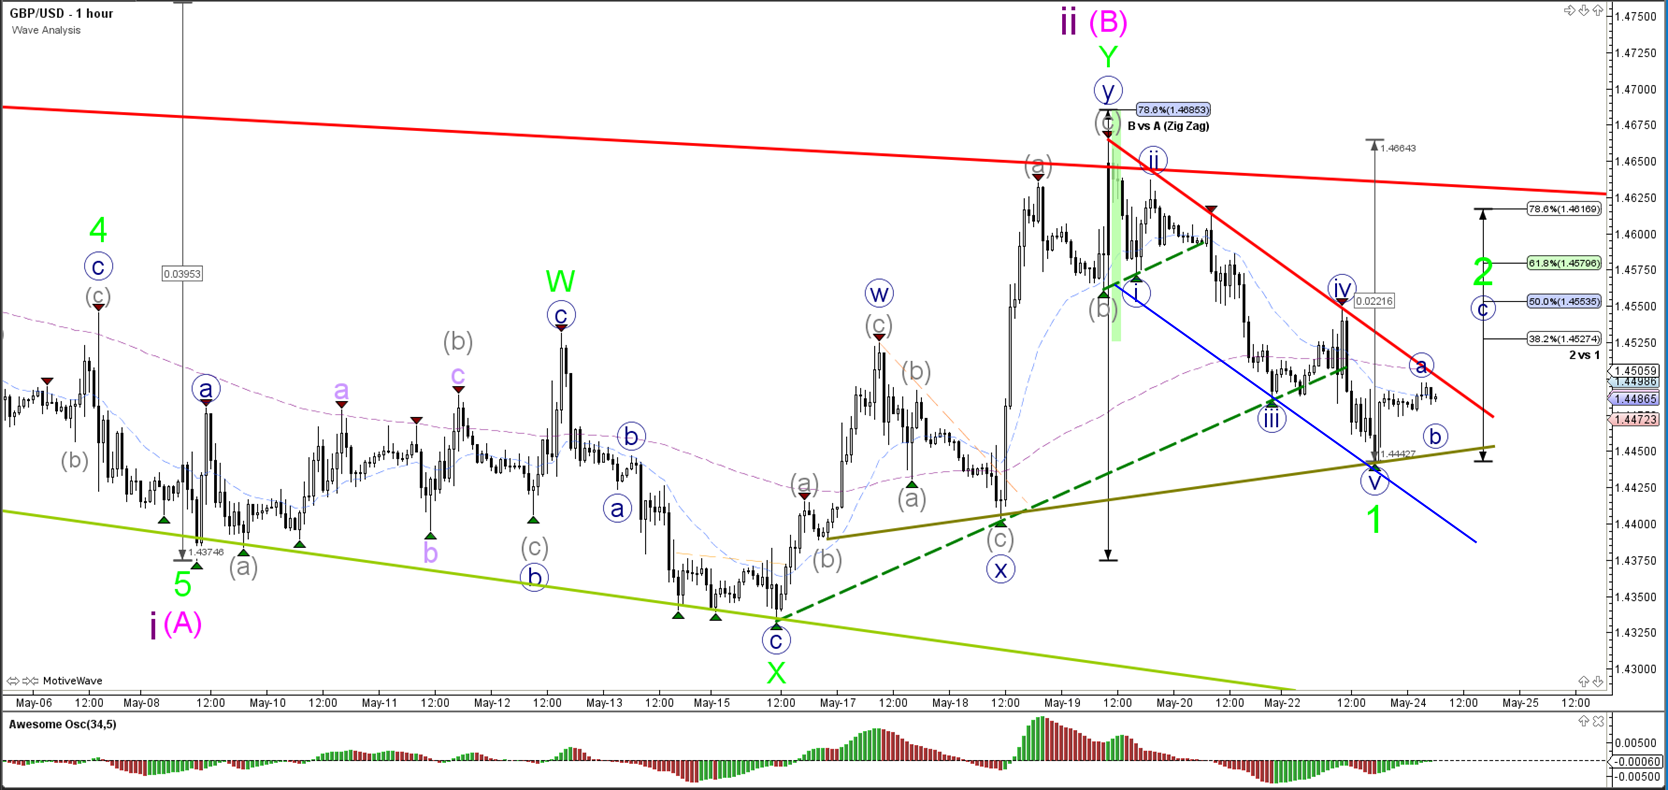
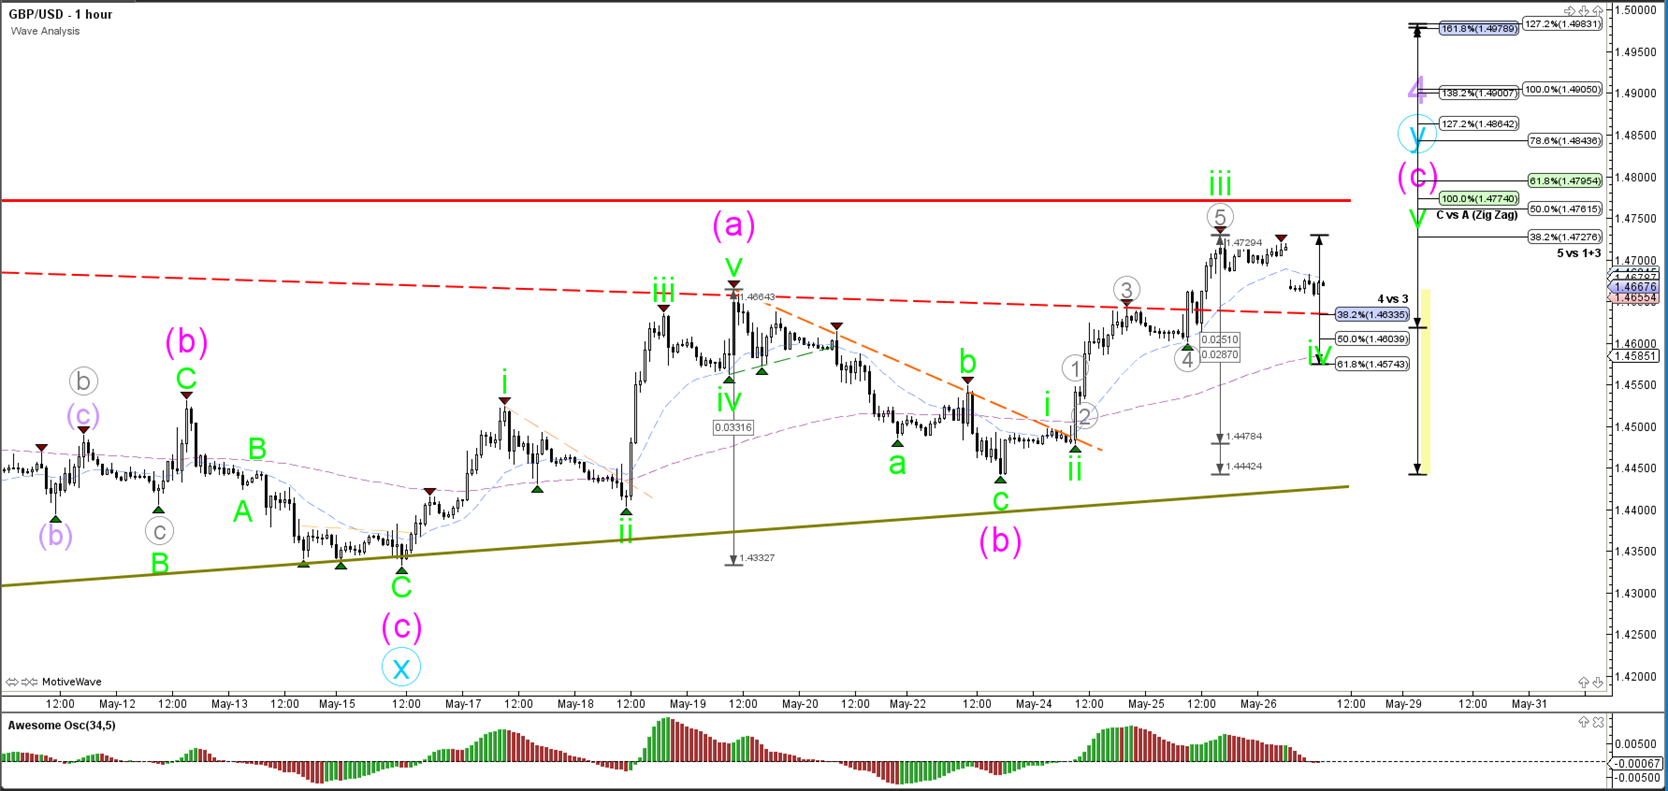
1 hour

The GBP/USD built a bullish ABC zigzag (blue) yesterday. Price would need to break below support (green) for a potential bearish breakout. A break above resistance could still see price struggle at the Fibonacci levels of wave B vs A.
USD/JPY
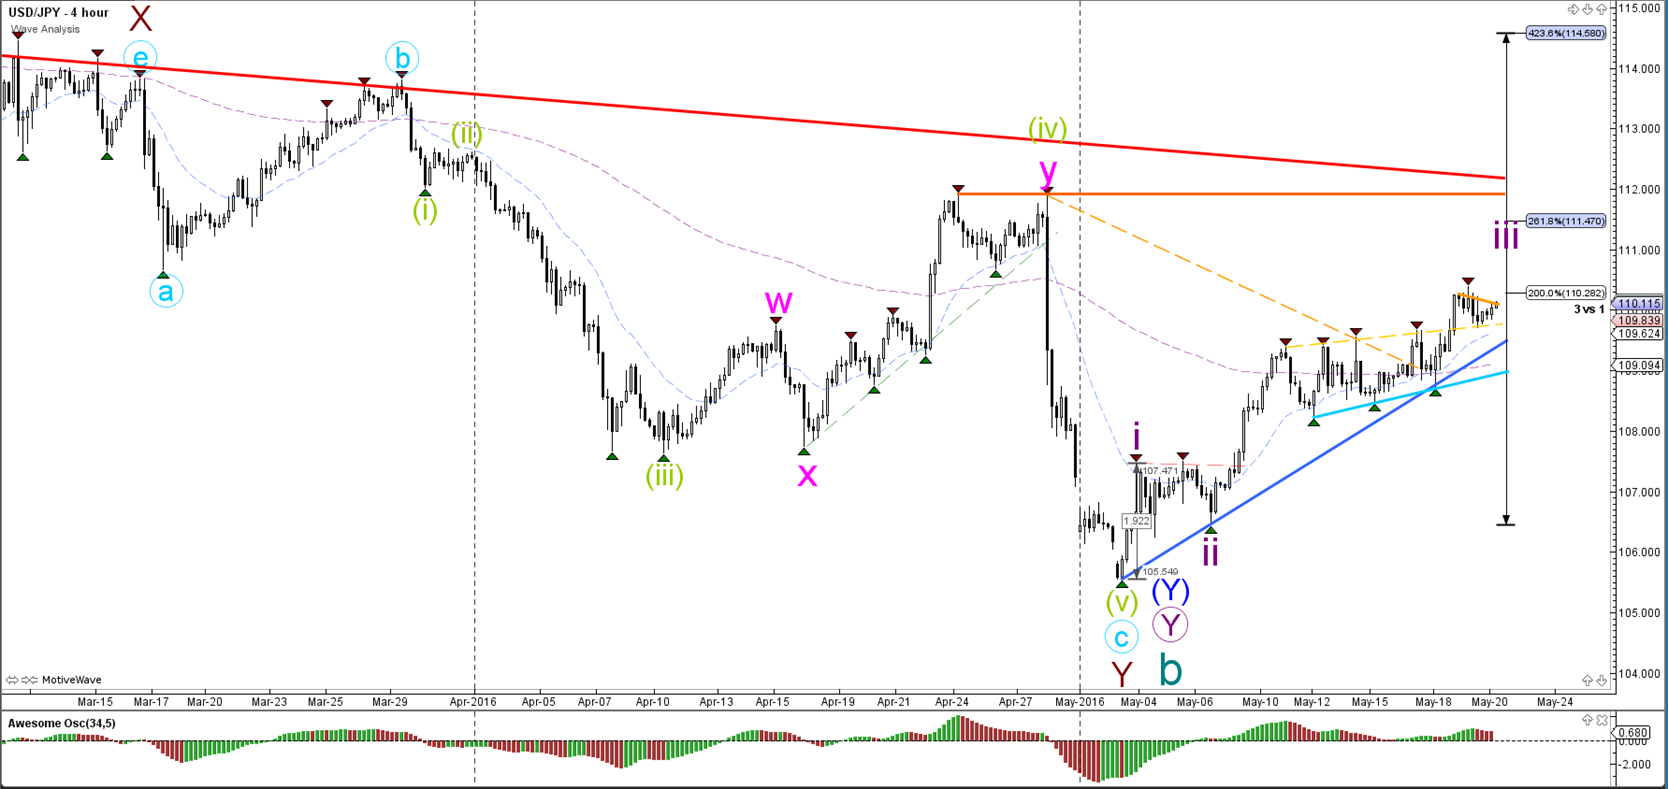
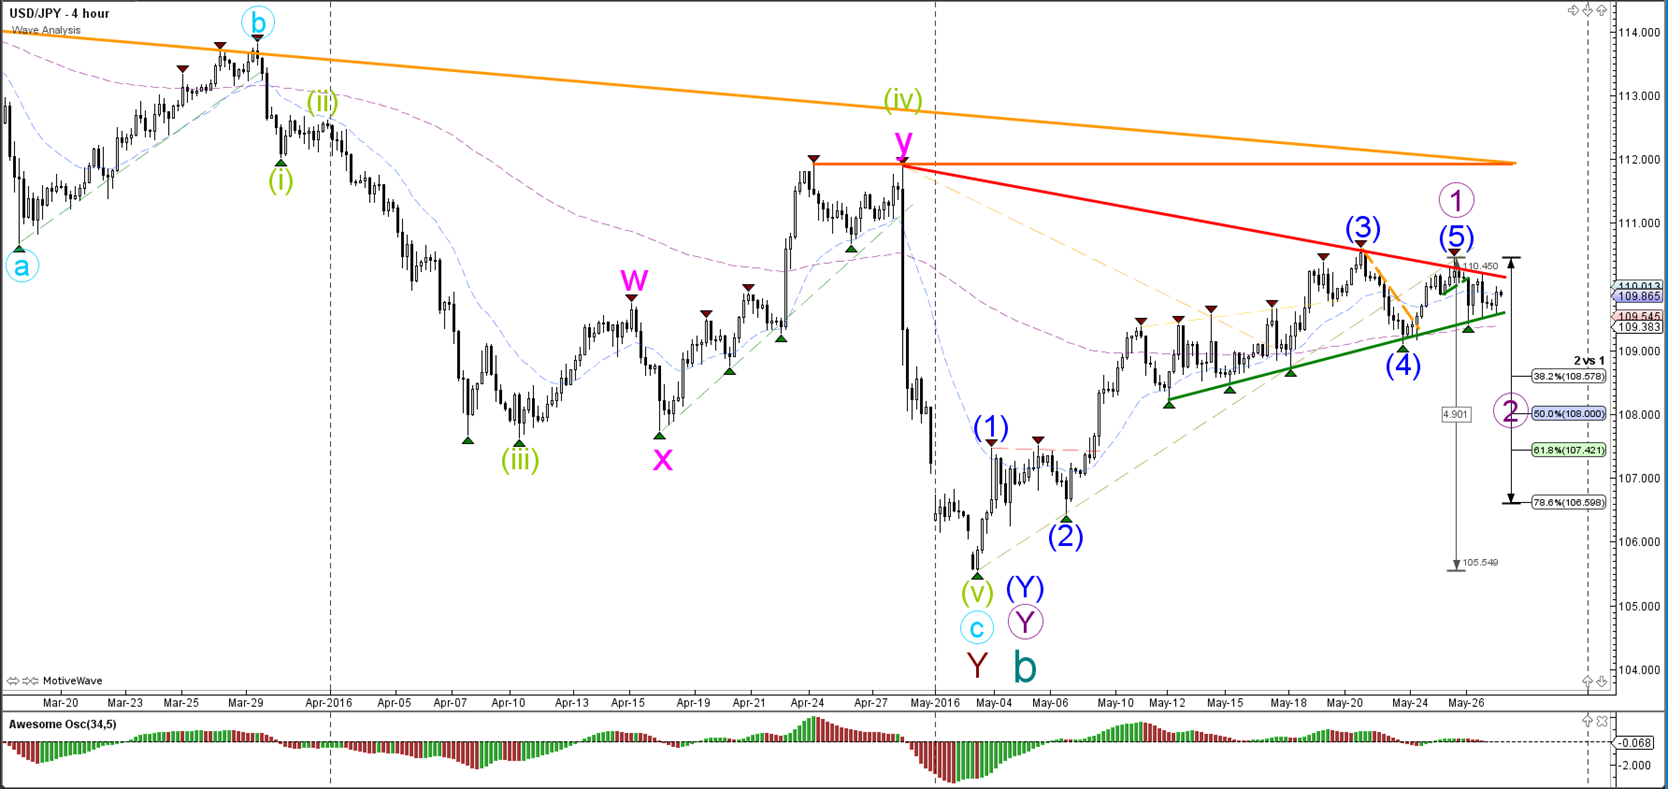
4 hour
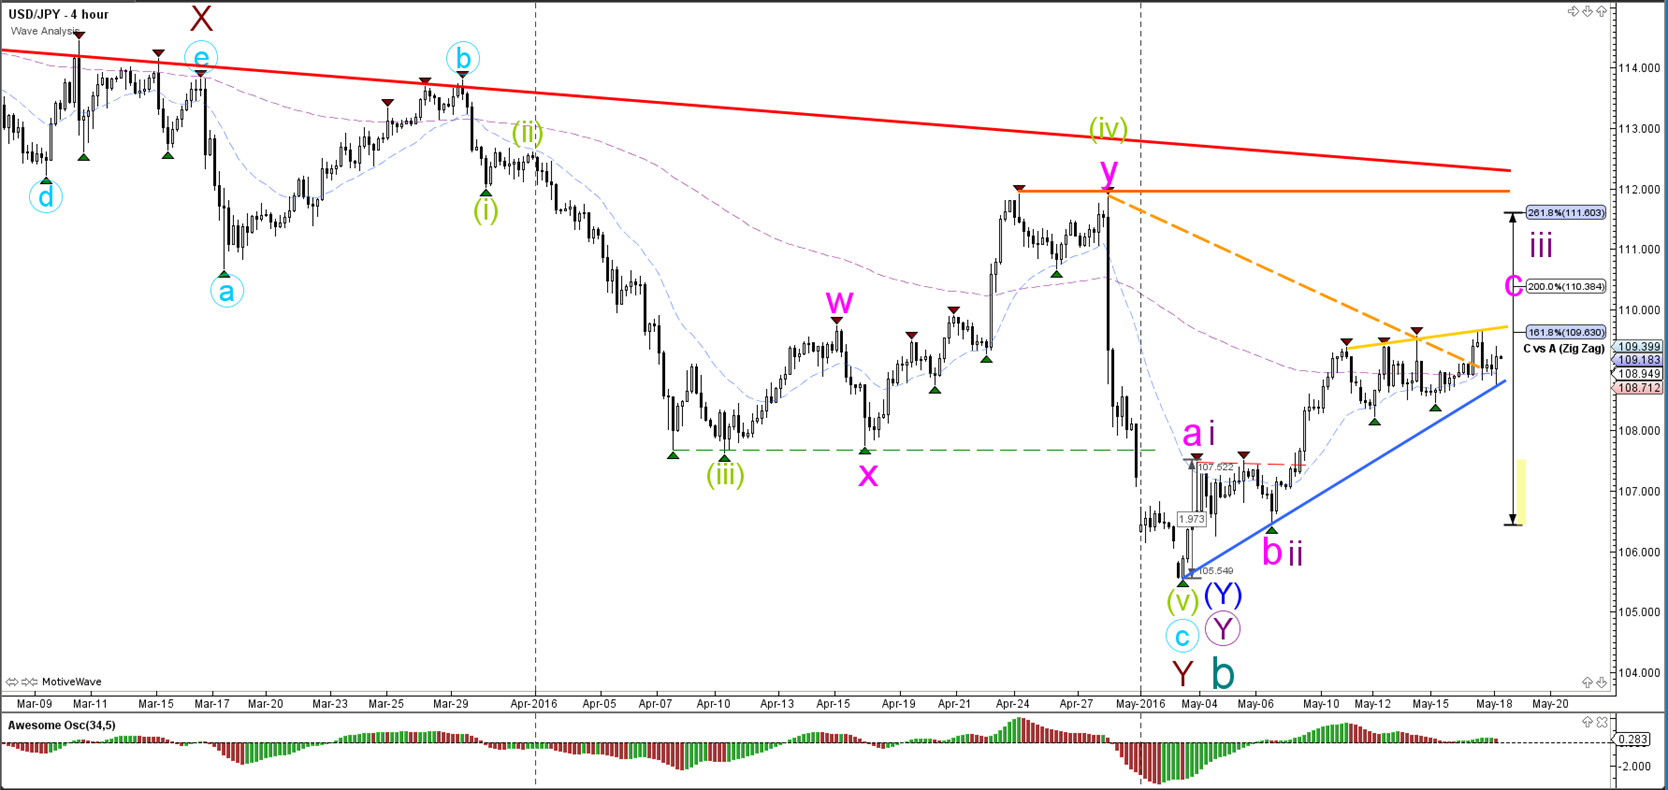
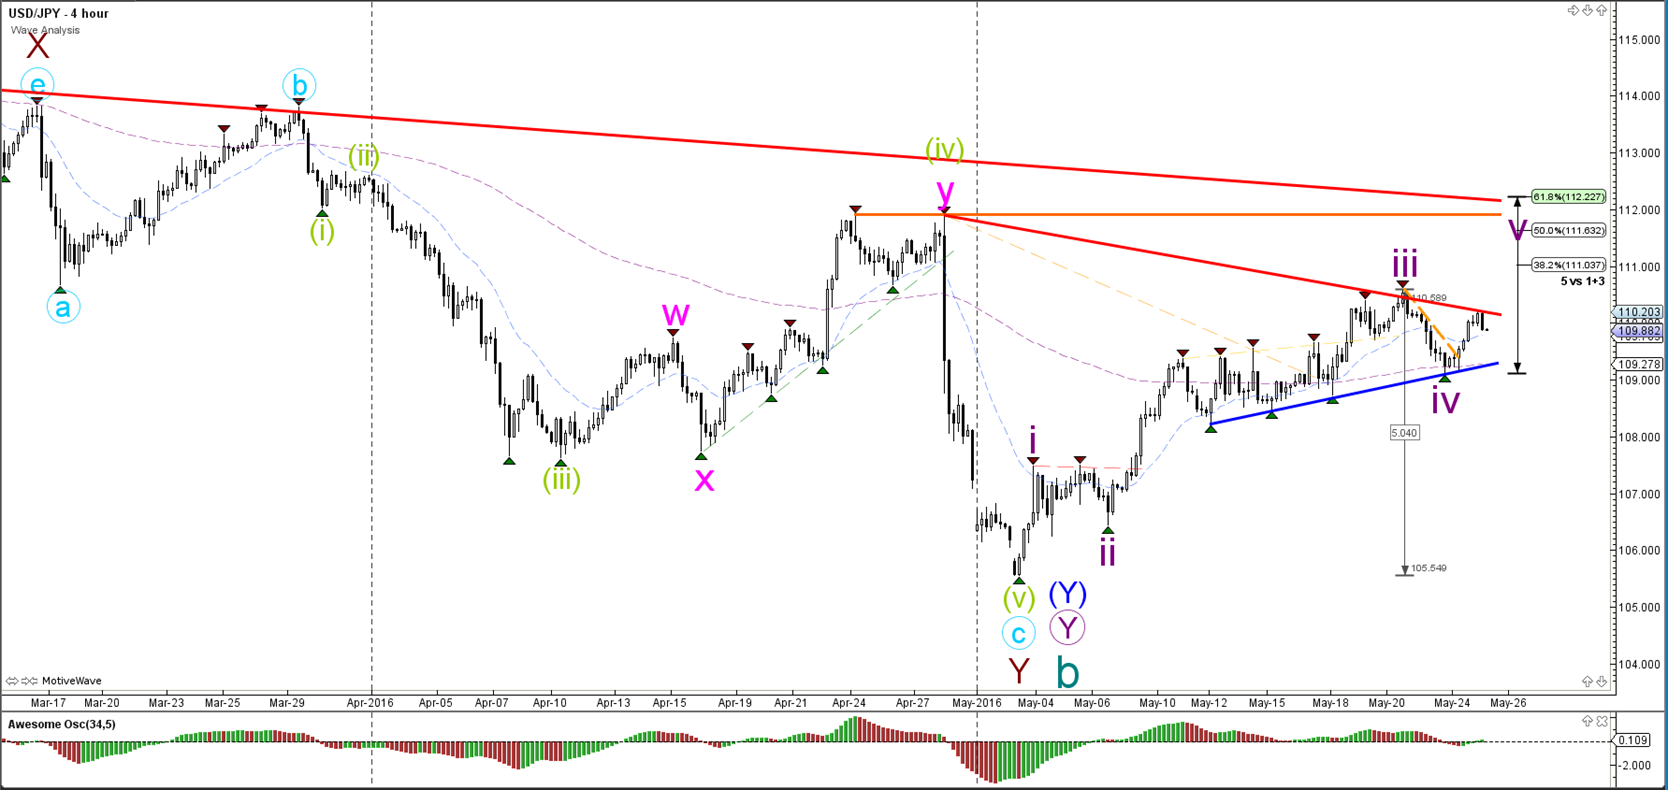
The USD/JPY broke above the resistance trend line (orange dotted) but the breakout has been slow so far. A potential USD/JPY break above the 161.8% Fibonacci target favors a wave 3 (purple) whereas a bearish break below the support trend line (blue) makes a wave C (pink) more likely.
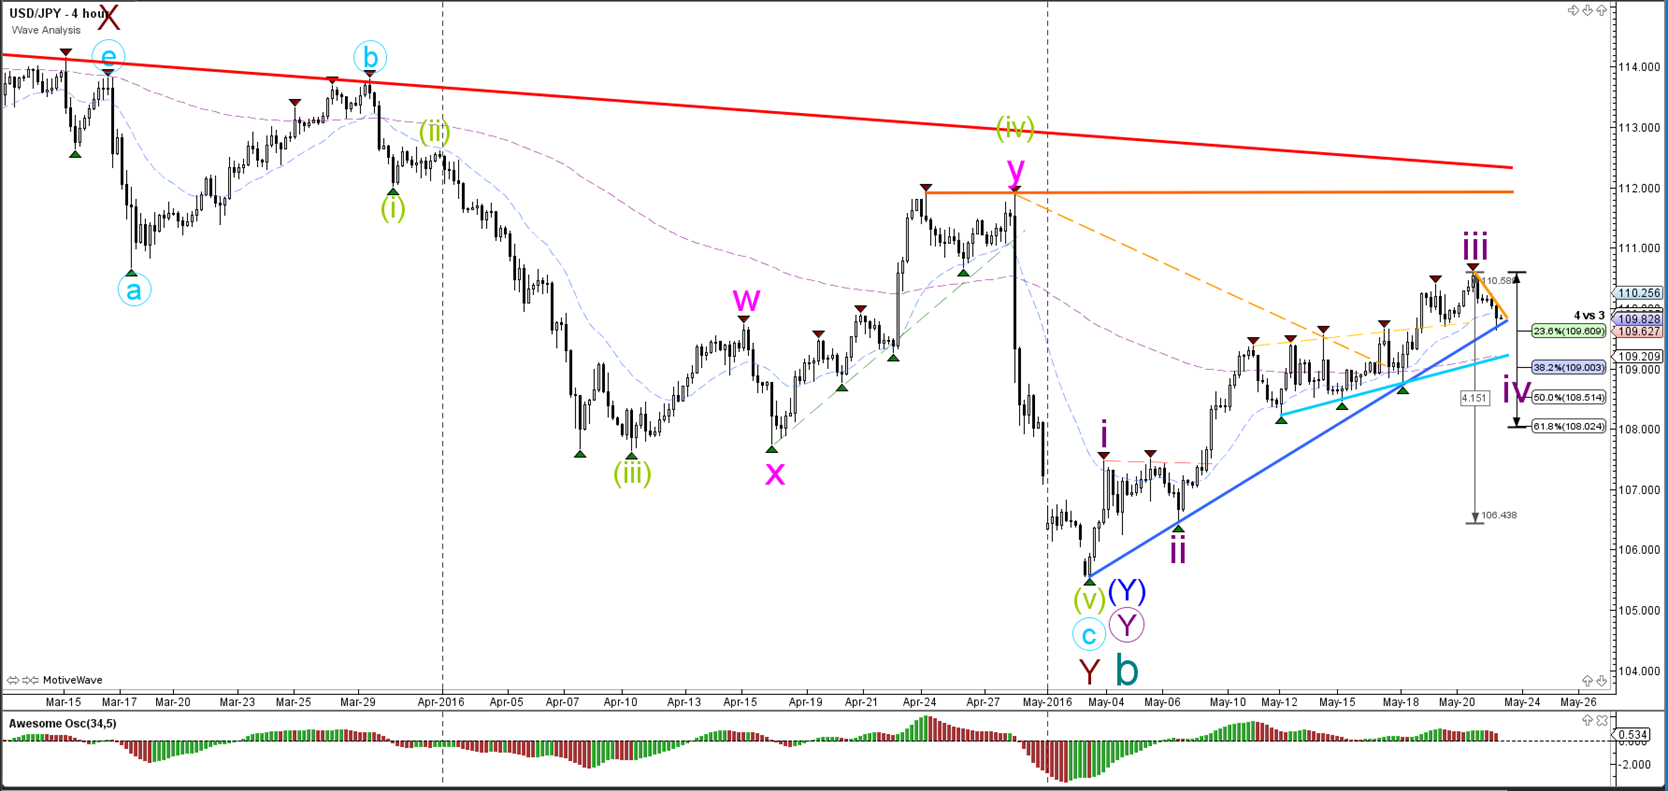
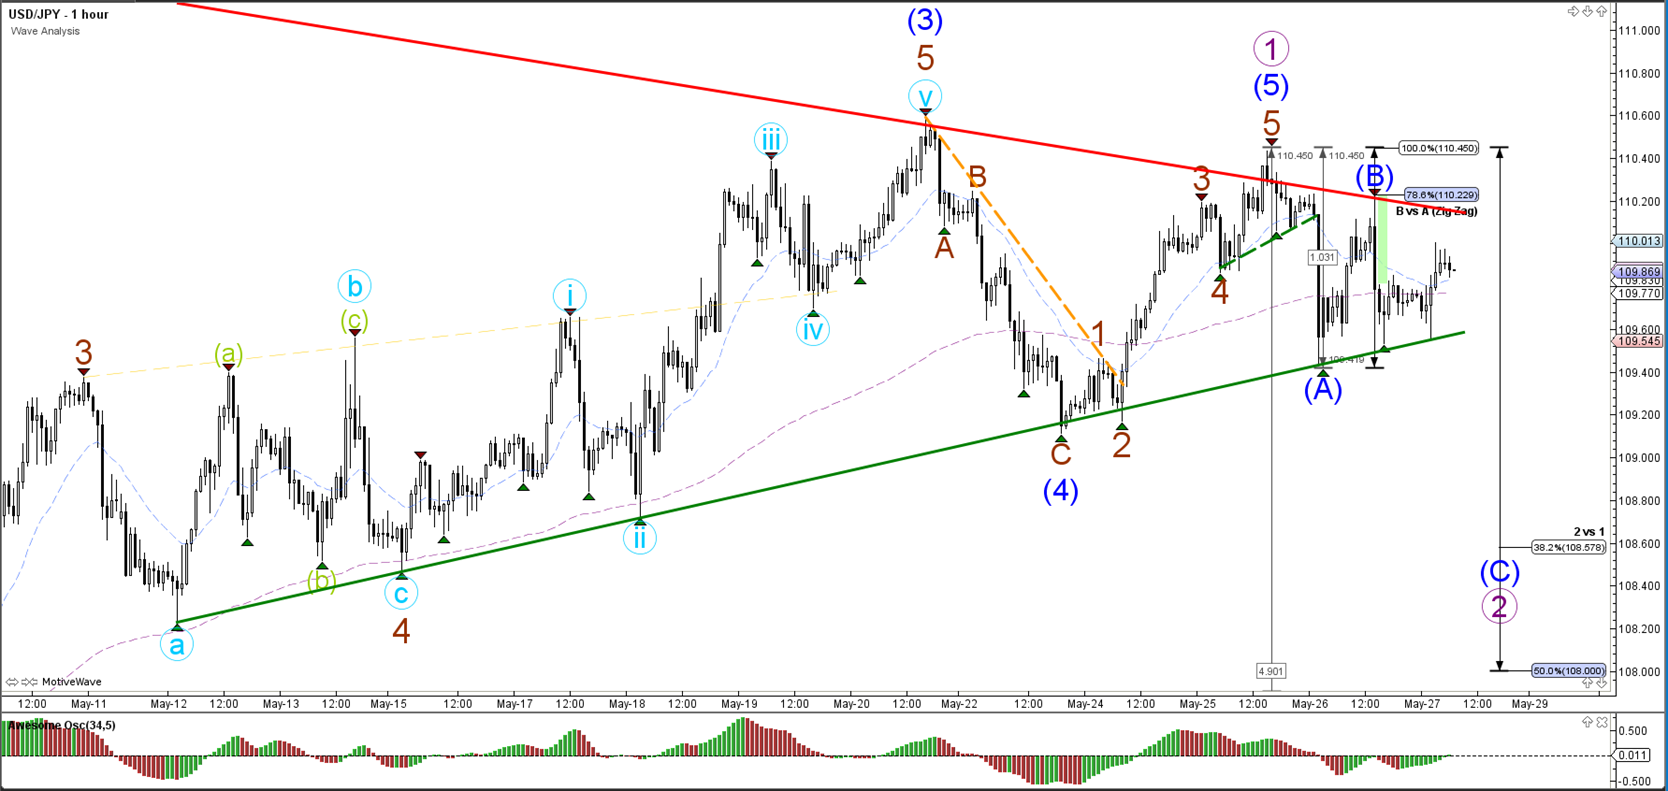
1 hour

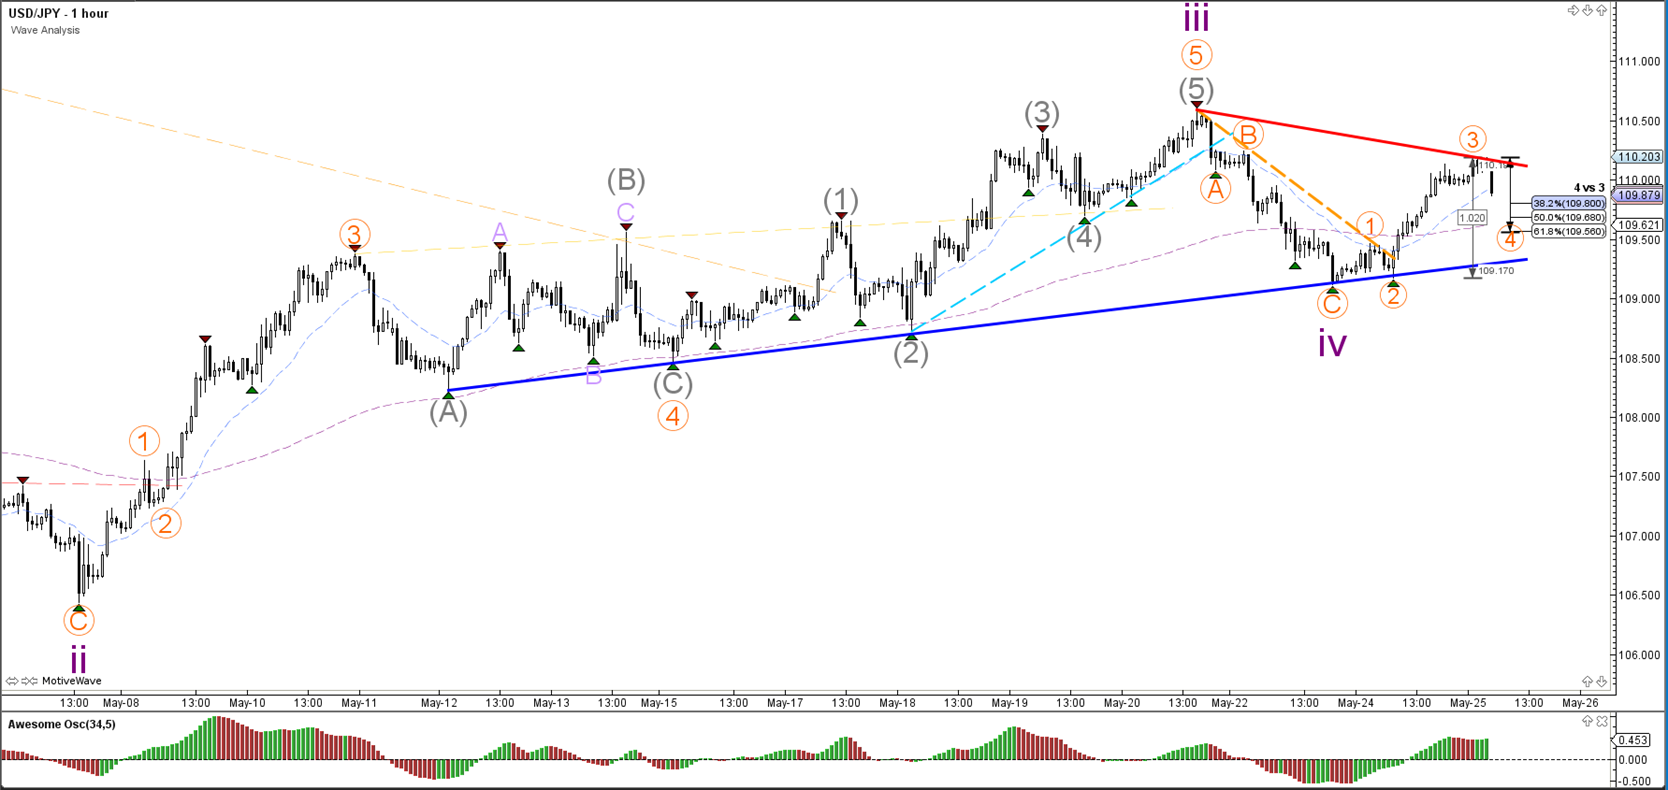
The USD/JPY is in a slightly bullish angled channel between support (blue) and resistance (orange). The recent pullback could be a wave 1-2 (grey) pullback as long price does not break below the origin of wave 1.
“Original analysis is provided by Admiral Markets”
EUR/USD
4 hour

The EUR/USD broke the bear flag chart pattern (dotted purple) as price heads lower to the Fibonacci targets. For the moment the wave count has been labeled as a continuation of wave C (blue). The alternative is a wave 3 if price manages to break below the 161.8% Fibonacci target.
1 hour

The EUR/USD breaks another support trend line (purple) and is building a decline as part of a wave 5 (orange). The blue line is a strong bottom from the 4 hour chart which could act as a bouncing spot.
GBP/USD
4 hour

The GBP/USD has respected the resistance level (orange) at the 38.2% Fibonacci level. All of the Fibonacci levels and resistance trend lines offer a strong resistance zone. A break above the 100% Fibonacci level invalidates the current wave count.
1 hour

The GBP/USD built a bullish ABC zigzag (blue) yesterday. Price would need to break below support (green) for a potential bearish breakout. A break above resistance could still see price struggle at the Fibonacci levels of wave B vs A.
USD/JPY
4 hour

The USD/JPY broke above the resistance trend line (orange dotted) but the breakout has been slow so far. A potential USD/JPY break above the 161.8% Fibonacci target favors a wave 3 (purple) whereas a bearish break below the support trend line (blue) makes a wave C (pink) more likely.
1 hour
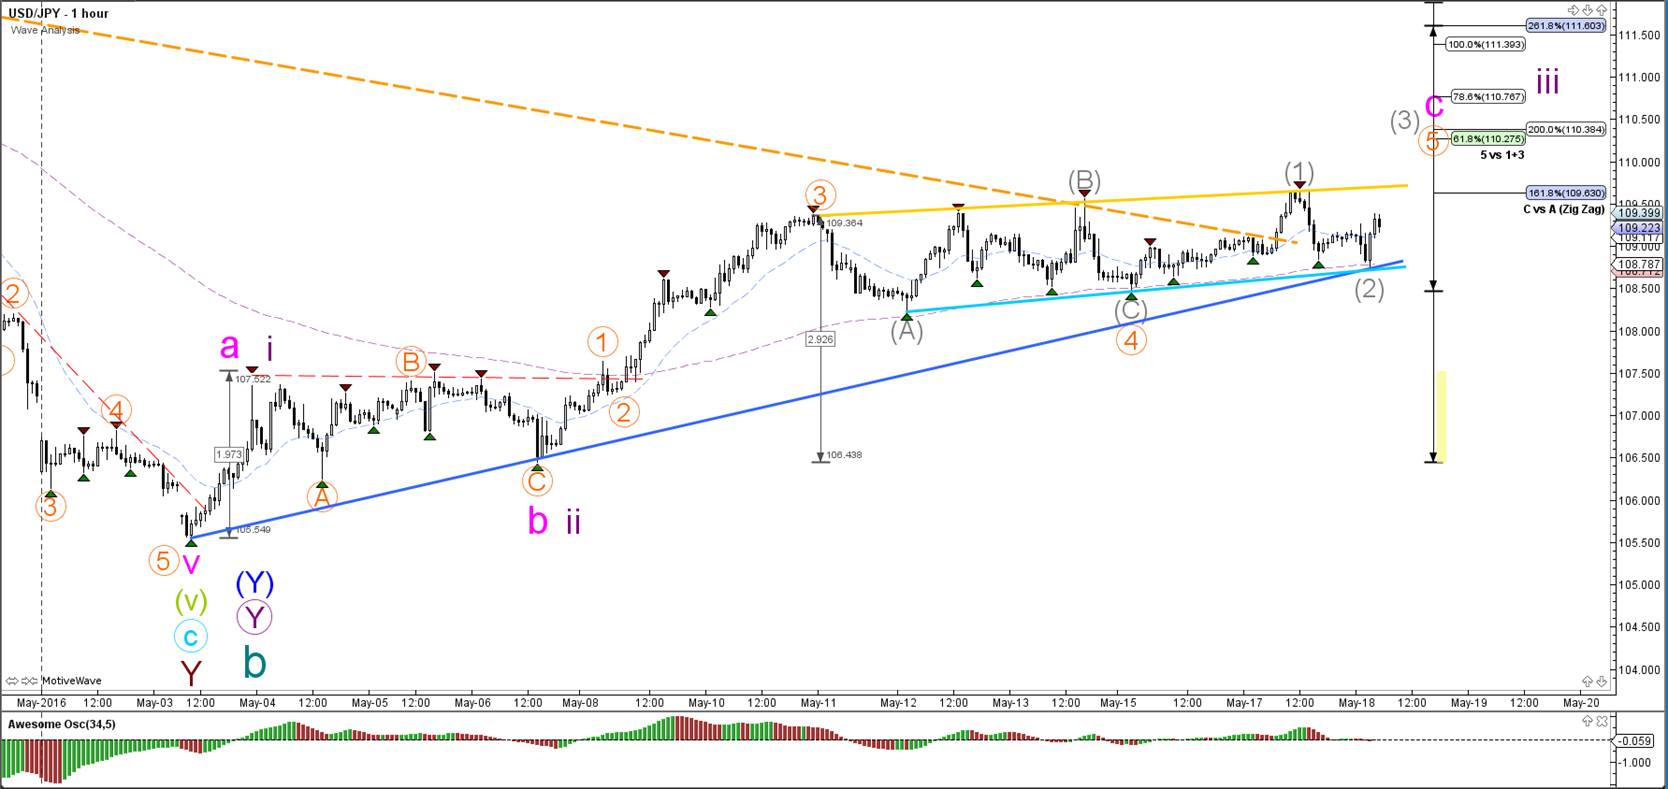
The USD/JPY is in a slightly bullish angled channel between support (blue) and resistance (orange). The recent pullback could be a wave 1-2 (grey) pullback as long price does not break below the origin of wave 1.
“Original analysis is provided by Admiral Markets”