Vladimir's Forex Signals and Mentoring

Short term trade opportunities for GBPUSD

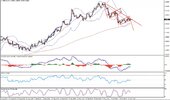
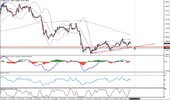
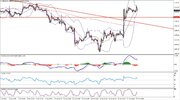
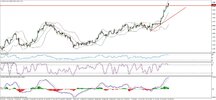
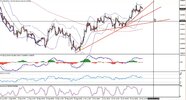
There is bullish hidden divergence forming on the D1 chart along with H4 bullish divergence.
The down trend line and resistance around 1.6010/1.6020 should be broken in order for the
pair to gain bullish momentum. If it manages to close and hold above this level we can enter
long with targets around 1.6120/1.6180. Protection below last low.

Alternatively we should also look for sell opportunities.
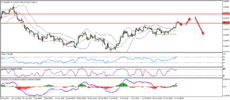
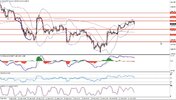
Weekly and H4 charts have bearish hidden divergence.
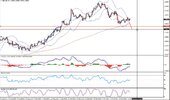
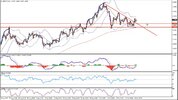
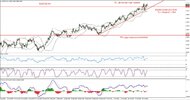
The pair is trading in a pattern as shown on the screenshot.
If the current channel is broken down we might expect another
wave to the down side. If the up trend line on the H4 and
support around 1.5960 are broken we will be looking to short the
cable.
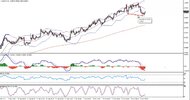
TP1: 1.5910/1.5880 (gap close)
TP2: duplication of the move (see screenshot)
SL: above last high
gu1.jpggu2.jpggu3.jpggu4.jpg
 
Looking forward to buy GBPCAD from the major support

GBPCAD presents good buy opportunity in the short term as
it has double divergence along with bullish hidden divergence on D1.
The pair broke the triangle on the H4 chart recently. Now we are
looking for retest of the broken triangle and support zone around
1.6545/55. If it manages to hold above the trend line and the support
we will enter long.
TP1: 1.6680/ 1.6720
TP2: 1.6780 (around last high)
SL: 1.6540

gbpcad_img.jpg
 
Eyeing GOLD for a short term buy opportunity

After the break of the down trend line we are now looking to long the gold.
We base our entry on the H1 chart. A pullback to support around 1295/1305
should be our trigger for a buy. A more conservative way to enter would be
with bullish candle pattern around these levels.
TP1: 1340
TP2: last high
SL: close the trade manually if the price closes below the broken trend line on the H4


gold.jpg
 
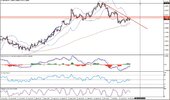
Watching NZDUSD closely for a sell opportunity

We have been following NZDUSD for quite some time now.
There is hidden <span class="glossarylink">

<a href="https://www.forexpeacearmy.com/forex-forum/vbglossar.php?do=showentry&amp;item=bearish" onmouseover="return overlib('In stocks, bearish means that the price of a stock is going down (or you think it will go down). Since forex is traded in pairs, bearish means the pr [...]');" onmouseout="return nd();">
<img class="inlineimg" src="https://www.forexpeacearmy.com/forex-forum/images/styles/f4/misc/vbglossarlink.gif" border="0" /></a> <a href="https://www.forexpeacearmy.com/forex-forum/vbglossar.php?do=showentry&amp;item=bearish" onmouseover="return overlib('In stocks, bearish means that the price of a stock is going down (or you think it will go down). Since forex is traded in pairs, bearish means the pr [...]');" onmouseout="return nd();">bearish</a>


</span> divergence on W1 and <span class="glossarylink">

<a href="https://www.forexpeacearmy.com/forex-forum/vbglossar.php?do=showentry&amp;item=bearish" onmouseover="return overlib('In stocks, bearish means that the price of a stock is going down (or you think it will go down). Since forex is traded in pairs, bearish means the pr [...]');" onmouseout="return nd();">
<img class="inlineimg" src="https://www.forexpeacearmy.com/forex-forum/images/styles/f4/misc/vbglossarlink.gif" border="0" /></a> <a href="https://www.forexpeacearmy.com/forex-forum/vbglossar.php?do=showentry&amp;item=bearish" onmouseover="return overlib('In stocks, bearish means that the price of a stock is going down (or you think it will go down). Since forex is traded in pairs, bearish means the pr [...]');" onmouseout="return nd();">bearish</a>


</span> divergence on D1.
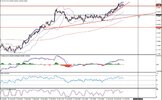
Also an up trend line on the H4. Our sell <span class="glossarylink">

<a href="https://www.forexpeacearmy.com/forex-forum/vbglossar.php?do=showentry&amp;item=trigger" onmouseover="return overlib('In news trading signals, the minimum amount of deviation from expectations to make it worth risking entering a trade. Forex Traders Glossary [...]');" onmouseout="return nd();">
<img class="inlineimg" src="https://www.forexpeacearmy.com/forex-forum/images/styles/f4/misc/vbglossarlink.gif" border="0" /></a> <a href="https://www.forexpeacearmy.com/forex-forum/vbglossar.php?do=showentry&amp;item=trigger" onmouseover="return overlib('In news trading signals, the minimum amount of deviation from expectations to make it worth risking entering a trade. Forex Traders Glossary [...]');" onmouseout="return nd();">trigger</a>


</span> will be the break and hold of the
4 hour trend linen along with the most recent <span class="glossarylink">

<a href="https://www.forexpeacearmy.com/forex-forum/vbglossar.php?do=showentry&amp;item=support" onmouseover="return overlib('Support is a price level (often an area, not an EXACT price) that traders tend to buy at. This often prevents price from falling below this level, th [...]');" onmouseout="return nd();">
<img class="inlineimg" src="https://www.forexpeacearmy.com/forex-forum/images/styles/f4/misc/vbglossarlink.gif" border="0" /></a> <a href="https://www.forexpeacearmy.com/forex-forum/vbglossar.php?do=showentry&amp;item=support" onmouseover="return overlib('Support is a price level (often an area, not an EXACT price) that traders tend to buy at. This often prevents price from falling below this level, th [...]');" onmouseout="return nd();">support</a>


</span>, which at the moment is
at 0.8450 level.
TP1: next up trend line on H4
TP2: Gap around 0.8140
SL: above last high

(if against the rules please remove the link, thanks)
Video Explanation: [video=youtube_share;ut4fL8NWBRQ]http://youtu.be/ut4fL8NWBRQ[/video]
nzdusd3.jpg
 
Last edited:
Looking forward to sell highs on EURGBP

According to last <span class="glossarylink"><a href="https://www.forexpeacearmy.com/forex-forum/vbglossar.php?do=showentry&amp;item=bullish" onmouseover="return overlib('In stocks, bullish means that the price of a stock is going up (or you think it will go up). Since forex is traded in pairs, bullish means the price [...]');" onmouseout="return nd();">
<img class="inlineimg" src="https://www.forexpeacearmy.com/forex-forum/images/styles/f4/misc/vbglossarlink.gif" border="0" /></a> <a href="https://www.forexpeacearmy.com/forex-forum/vbglossar.php?do=showentry&amp;item=bullish" onmouseover="return overlib('In stocks, bullish means that the price of a stock is going up (or you think it will go up). Since forex is traded in pairs, bullish means the price [...]');" onmouseout="return nd();">bullish</a></span> divergence on Daily chart we expect the price to rise to around <span class="glossarylink"><a href="https://www.forexpeacearmy.com/forex-forum/vbglossar.php?do=showentry&amp;item=resistance" onmouseover="return overlib('Resistance is a price level (often an area, not an EXACT price) that traders tend to sell at. This often prevents price from going above this level, [...]');" onmouseout="return nd();"><img class="inlineimg" src="https://www.forexpeacearmy.com/forex-forum/images/styles/f4/misc/vbglossarlink.gif" border="0" /></a> <a href="https://www.forexpeacearmy.com/forex-forum/vbglossar.php?do=showentry&amp;item=resistance" onmouseover="return overlib('Resistance is a price level (often an area, not an EXACT price) that traders tend to sell at. This often prevents price from going above this level, [...]');" onmouseout="return nd();">resistance</a></span> #3. Now there is <span class="glossarylink"><a href="https://www.forexpeacearmy.com/forex-forum/vbglossar.php?do=showentry&amp;item=bearish" onmouseover="return overlib('In stocks, bearish means that the price of a stock is going down (or you think it will go down). Since forex is traded in pairs, bearish means the pr [...]');" onmouseout="return nd();"><img class="inlineimg" src="https://www.forexpeacearmy.com/forex-forum/images/styles/f4/misc/vbglossarlink.gif" border="0" /></a> <a href="https://www.forexpeacearmy.com/forex-forum/vbglossar.php?do=showentry&amp;item=bearish" onmouseover="return overlib('In stocks, bearish means that the price of a stock is going down (or you think it will go down). Since forex is traded in pairs, bearish means the pr [...]');" onmouseout="return nd();">bearish</a></span> hidden divergence on D1. We anticipate the price to make a stop in the <span class="glossarylink">

<a href="https://www.forexpeacearmy.com/forex-forum/vbglossar.php?do=showentry&amp;item=resistance" onmouseover="return overlib('Resistance is a price level (often an area, not an EXACT price) that traders tend to sell at. This often prevents price from going above this level, [...]');" onmouseout="return nd();">
<img class="inlineimg" src="https://www.forexpeacearmy.com/forex-forum/images/styles/f4/misc/vbglossarlink.gif" border="0" /></a> <a href="https://www.forexpeacearmy.com/forex-forum/vbglossar.php?do=showentry&amp;item=resistance" onmouseover="return overlib('Resistance is a price level (often an area, not an EXACT price) that traders tend to sell at. This often prevents price from going above this level, [...]');" onmouseout="return nd();">resistance</a></span> zone between 0.8520-0.8580. On the H4 chart RSI is coming
to an extreme. We will be looking for <span class="glossarylink"><a href="https://www.forexpeacearmy.com/forex-forum/vbglossar.php?do=showentry&amp;item=bearish" onmouseover="return overlib('In stocks, bearish means that the price of a stock is going down (or you think it will go down). Since forex is traded in pairs, bearish means the pr [...]');" onmouseout="return nd();"><img class="inlineimg" src="https://www.forexpeacearmy.com/forex-forum/images/styles/f4/misc/vbglossarlink.gif" border="0" /></a> <a href="https://www.forexpeacearmy.com/forex-forum/vbglossar.php?do=showentry&amp;item=bearish" onmouseover="return overlib('In stocks, bearish means that the price of a stock is going down (or you think it will go down). Since forex is traded in pairs, bearish means the pr [...]');" onmouseout="return nd();">bearish</a></span> divergence to form and then we will sell.
eurgbp_1.png

[video=youtube_share;O1IJME6Z5k0]http://youtu.be/O1IJME6Z5k0[/video]
 
Great AUDCAD sell setup !

We continue to follow AUDCAD and look for sell entry trigger.
Weekly hidden bearish divergence is a fact, Daily chart has continuing bearish divergence
and an up trend line that we pay close attention to, RSI on D1 is coming to
an extreme. All technical analysis point to bearish outlook. We anticipate for
H4 trend line break and hold with most recent support to enter sell.
Alternatively for more conservative entry you can look for daily trend line break.

TP1: gap close around 0.9570
SL: above last high created

aud_cad_picture.jpg
 
Extremes on EURCAD create amazing sell opportunity

D1 chart is close to extreme. The pair is in front of resistance on the weekly chart. RSI on weekly is also close to extreme. H4 chart is already in the extreme zone
according to RSI and started to form a bearish divergence.
One way to enter will be with a false break on the H4 of the 1.44 level
Alternatively if it pushes higher we will be watching MACD to create another
bullish slope and then a tick to the down side together with RSI which will create
extreme divergence and will be our sell trigger.
Initial target will be the meeting with the up trend line that has not been tested yet
SL: above last high created

eurcadh4.jpg
 
Short term sell opportunity for EURGBP

We believe pair is reaching a top and we should be looking for a sell setup
There are 2 up trend lines on H4. Break below the most recent
up trend line together with the support at 0.8520 on the H4.
then we will be looking for H1 bar to hold below and form a bearish candle pattern
in order to enter.
Tp1 - second trend line
Tp2: 200 MA on H4
SL: above last resistance

eurgbp3.jpg
 
Looking forward to sell GOLD from higher levels

Since US dollar weakened, Gold has been trading higher.
Now there is bearish hidden divergence forming on D1 along with
continuing divergence on H4. We are looking to sell gold at any of the
major resistances on it's way - 1354, 1365 and 1380. Bearish candle
pattern around these zones will be our sell trigger.
TP1: 1325
TP2: 1280
SL: above last high

NOTE: H4 bullish divergence after the entry will also be an exit sign

gold2.jpg
 
Looking forward to sell rallies in AUDCAD

The pair created bearish convergence on the H4 chart so we should be looking to sell the pullback as it occurs.
On the H1 chart there is double bottom which means the move can be doubled and the pair may push higher
before the retrace. Important levels to pay attention to are 0.9960 to 0.9980. If tha pair makes a stop around this
zone with a bearish candle pattern and bearish divergence we will jump into a sell. Bear in mind there are important
news release scheduled for later today so trade carefully.
TP1: 0.9890 (last low)
TP2: 0.9780 (next support)
SL: above last high

Chart1.jpg
 
Back
Top