2023 Market Forecast by Solid ECN

US100 Surges Nearly %2.5

Wall Street rallies ahead of big tech earnings

US indices rose sharply today, extending Friday gains as risk appetite improved bolstered by the lack of Fed members' speeches, due to the blackout period, ahead of the FOMC meeting on January 31 – February 1. Now investors brace themselves for a busy week of earnings, including top tech giants Microsoft, Tesla, IBM, and Intel.

Recent economic data have magnified concerns that the US economy is near a recession while boosting bets that the Fed will continue to raise rates however at a slower pace. Wall Street Journal Fed insider, claims that the US central bank will announce a 25 basis point rate hike next week, which boosted upbeat sentiment. Later this week we get the US GDP and inflation data releases, which may increase volatility on the markets and influence FED decision.
us100.png


US100 jumped above major resistance at 11500 pts and 50 SMA (green line) on Friday and during today's session buyers breached long-term downward trendline. Currently the index is approaching 200 SMA (red line) and if buyers manage to uphold momentum resistance at 13000 pts may be at risk. This level is marked with previous price reactions and 38.2% Fibonacci retracement of the upward wave started in March 2020.​
 
EURJPY Keeps the Bearish Bias

EURJPY pair provided negative close below the additional barrier 142 yesterday, to increase the chances of activating the negative attack again, while the current weak trades are caused by stochastic contradiction against the moving average 55 that provides negative signals by settling below the mentioned barrier.

eurjpy.png


These factors allow us to expect forming temporary sideways fluctuation until gathering the additional negative momentum to ease the mission of starting the negative attack and press on 140.25 level soon, while breaking it will confirm the continuation of the negativity by targeting 139.4 and 138.2 levels.​
 
Silver - The price is in a correction and may grow.

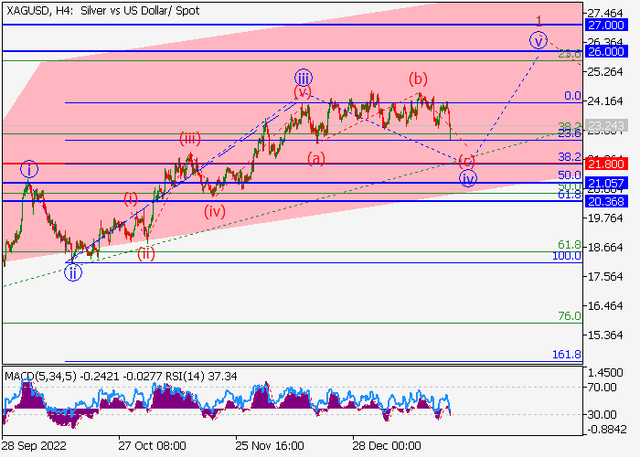
On the daily chart, a downward correction of the higher level ended as the second wave (2), and the third wave (3) forms, within which the entry first wave of the lower level 1 of (3) develops. Now, the wave iii of 1 has formed, and a local correction is ending to develop as the wave iv of 1, within which the wave (c) of iv is developing.

If the assumption is correct, the XAGUSD pair will grow to the area of 26 – 27. In this scenario, critical stop loss level is 21.80.

silver.png
 

USDCHF Negotiates the Resistance

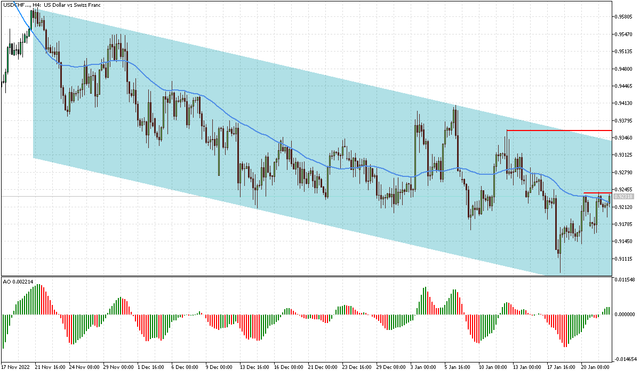
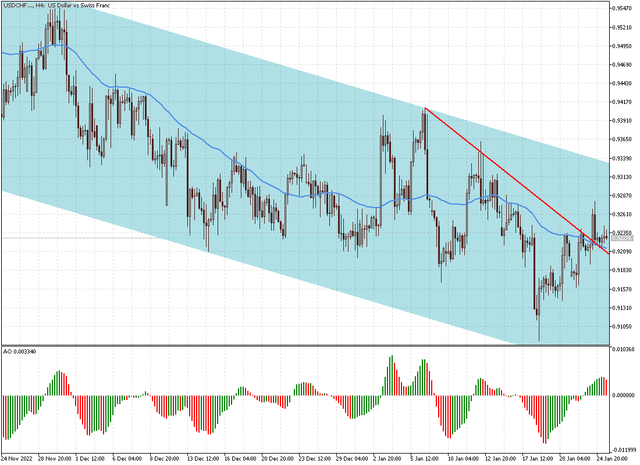
USDCHF pair provided new positive trades to test the bearish channel’s resistance, noticing that stochastic shows new negative signals now, waiting to motivate the price to resume the main bearish trend, which its targets begin at 0.9100 and extend to 0.9100.

usdchf.png


We remind you that breaching 0.9230 will push the price to start bullish correction that its targets begin by testing 0.9335 areas. The expected trading range for today is between 0.9140 support and 0.9275 resistance.​
 
Soy Technical Analysis

Bearish Scenario:

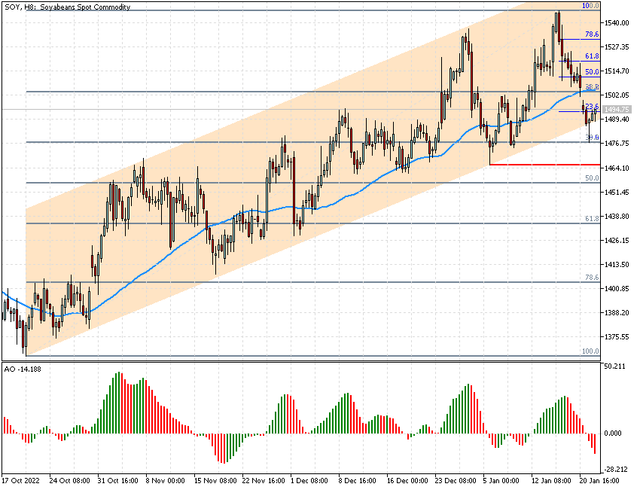
Soyabeans is trading in the upward channel, noting the AO indicator shows negative signals waiting to motivate the bears to confrim the break of the main bullish trend 1477.45 support (Fibo retracement 38.2) which extends to 1465.42 - 1456.05 (Fibo retracement 50).

soy.png


Bullish Scenario:
We see a hammer candle in 12 hours chart which can indicate trend reversal. Breaching MA 50 would push the price to continue the bullish trend that its targets begin by testing 1511.8 - 1520.16.​
 
GBPJPY Provides Sideways Trades

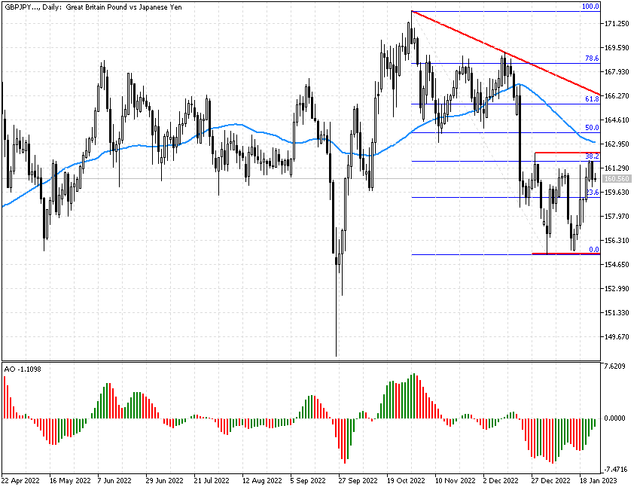
The GBPJPY pair continued to provide sideways trades to keep its stability within the bearish track that depends on the stability of the major resistance at 163.40, in addition to the continuous barrier formed at 162.10.

gbpjpy.png


Note that stochastic reach to the overbought areas hint getting rid of the positive pressures, to increase the chances of gathering the required negative momentum to provide new negative trades and wait to reach 158.60 followed by 157.10 levels soon. The expected trading range for today is between 161.80 and 159.25.​
 

XRPUSD - Current trend

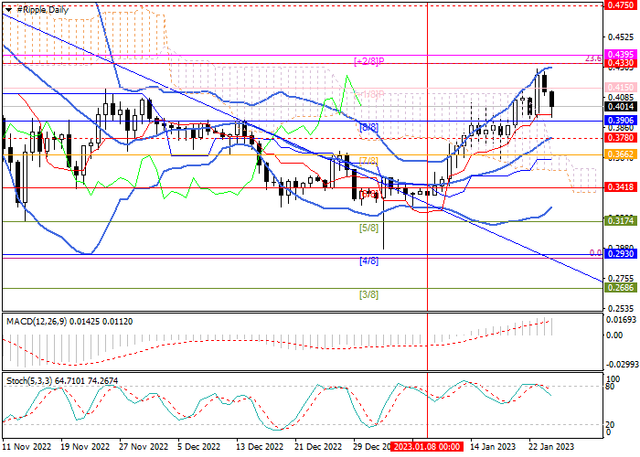
The XRPUSD pair has been growing within the general market trend since the beginning of this month, and this week has reached 0.4290 for the first time since November.

xrp.png


Currently, the quotes have corrected to the 0.4000 area, but the current short-term uptrend will be reversed only after the breakdown of the middle line of Bollinger bands in the 0.3780 area, and then the asset will be able to return to 0.3418 (Murrey level [6/8]) and 0.3174 (Murrey level [5/8]). The key "bullish" level is the resistance zone 0.4330–0.4395 (Fibonacci correction 23.6%, Murrey level [+2/8]), the breakout of which allows growth to 0.4750 and 0.5219 (Fibonacci correction 38.2%).

Resistance levels: 0.4395, 0.4750, 0.5219 | Support levels: 0.3780, 0.3418, 0.3174​
 

USDCHF Exits the Bearish Channel

The USDCHF pair traded with strong positivity yesterday to breach the bearish channel’s resistance and settles above it, to head towards building expected correctional bullish wave in the upcoming sessions, targeting 0.9335 areas initially.

usdchf.png


Therefore, the bullish bias will be suggested for today, taking into consideration that breaking 0.9195 will stop the expected rise and press on the price to resume the main bearish trend again. The expected trading range for today is between 0.9160 support and 0.9300 resistance.​
 
GBPCAD forms new bullish channel

The GBPCAD pair formed minor bullish wave recently as appears on the chart, to support the chances of resuming the bullish attack, as the continuous stability of 1.6420 support line and stochastic attempt to provide the positive momentum allow us to expect targeting 1.6745 level soon, while surpassing it will increase the chances of providing strong pressures on 1.6930 barrier, to form the next main target for the bullish trades.

gbpcad.png


The expected trading range for today is between 1.6550 and 1.6745.​
 

Dow Jones - The US stock market is preparing to continue its growth

Tesla Inc., an electric car maker, released financial results yesterday, with fourth-quarter revenue of 24.32 billion dollars, lower than forecast of 24.68 billion dollars, and with earnings per share of 1.19 dollars, higher than the previous quarter's figure of 1.05 dollars. In turn, technology giant IBM Corp. posted revenue of 16.70 billion dollars against a forecast of 16.13 billion dollars and earnings per share of 3.60 dollars, well above 1.81 dollars a quarter earlier.

Among the negative publications, one can single out yesterday's report of the manufacturer of aviation, space and military equipment, Boeing Co., whose quarterly revenue amounted to 19.98 billion dollars, an increase of 35.0% compared to the previous quarter. The company's recovery still failed to turn it into profit, with a loss per share of 1.75 dollars after -6.18 dollars per share in the previous quarter.

ym.png


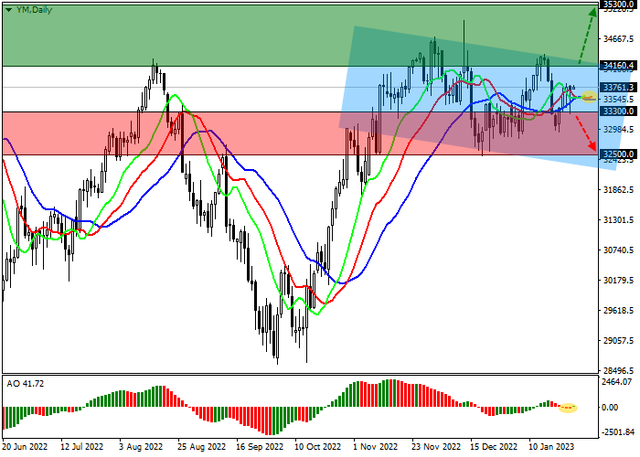
On the daily chart, the index quotes continue corrective dynamics, again trying to overcome the channel's resistance line at 34160, and the technical indicators are in a state of uncertainty.

Support levels: 33300, 32500 | Resistance levels: 34160, 35300​
 
Back
Top