Solid ECN | Daily Technical | Video | Major Products

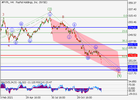
Silver, Elliot Wave Analysis

The pair may grow.
On the daily chart, the first wave of the higher level (1) of 3 formed, a downward correction developed as the wave (2) of 3, and the development of the third wave (3) of 3 started. Now, the first wave of the lower level i of 1 of (3) has formed, a local correction has developed as the wave ii of 1, and the wave iii of 1 is forming, within which the development of the wave (iv) of iii is ending. If the assumption is correct, after the end of the correction, the price will grow to the levels of 26.76–28.68. In this scenario, critical stop loss level is 22.72.​
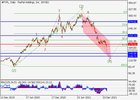
silver_1.pngsilver_2.png
 
PayPal Holdings, Elliot Wave Analysis

The price may fall.
On the daily chart, the third wave of the higher level (3) developed, and a downward correction develops as the fourth wave (4). Now, the wave C of (4) is forming, within which the third wave of the lower level iii of C has formed, a local correction has ended as the fourth wave iv of C, and the wave v of C is developing. If the assumption is correct, the price will fall to the levels of 140.00–128.71. In this scenario, critical stop loss level is 179.02.​
 

Attachments

  • paypal_1.png
    paypal_1.png
    23.2 KB · Views: 0
  • paypal_2.png
    paypal_2.png
    20.7 KB · Views: 0
AUD/USD, the instrument renews local lows

Current trend

During the Asian session, the AUD/USD pair shows flat dynamics, holding near the level of 0.7130. Yesterday, the instrument steadily declined, having renewed local lows of December 20. However, by the time the daily session was closed, it partially restored lost positions.

The asset was supported by poor US macroeconomic data, which reduced the likelihood that the US Federal Reserve would raise rates more than four times in 2022. Thus, Markit Manufacturing PMI for January fell from 57.7 to 55.0 points, while analysts' forecasts suggested a decline to 56.7 points. Service PMI fell from 57.6 to 50.9 points, which was worse than forecasts of 55.0 points.

On Tuesday, further development of the upward dynamics is facilitated by data from Australia. In the fourth quarter of 2021, the consumer price index increased by 1.3% QoQ and 3.5% YoY, which was better than analysts' forecasts of +1.0% QoQ and +3.2% YoY.

Support and resistance
On the daily chart, Bollinger bands try to reverse into a horizontal plane. The price range expands from below, but not as fast as the "bearish" activity develops. The MACD indicator shows a moderate decline and keeps the same sell signal (the histogram is below the signal line). Stochastic keeps its downtrend but is quickly approaching its lows, indicating that the instrument may become oversold in the ultra-short term.

Resistance levels: 0.7160, 0.7200, 0.7250, 0.7300.
Support levels: 0.7128, 0.7100, 0.7050, 0.7000.​

audusd_1.pngaudusd_2.png
 
GBP/USD, the "bearish" momentum intensifies

Current trend
The British pound remains under pressure due to the difficult epidemiological situation in the country and poor macroeconomic data, and the GBP/USD pair may continue to decline towards the 1.3418–1.3365 area. Thus, Composite PMI in industry and services in the UK fell to 53.4 points from 53.6 points a month earlier, while analysts expected the index to rise to 55.0 points.

The long-term trend in the GBP/USD pair is downwards. After the breakdown of 1.3610, the rate decreases to 1.3418–1.3365. If this area is broken, further development of negative dynamics to the lows of December 2021 is possible.

The medium-term trend remains upwards. A correction is developing within its trend, the target of which is to test the key support at 1.3405–1.3370, after which new purchases can be considered with the target at the year's high.

Support and resistance
Resistance levels: 1.3610, 1.3710, 1.3820.
Support levels: 1.3418, 1.3365, 1.3200.​

gbpusd_1.pnggbpusd_2.png
 
Ripple Technical analysis

Current trend

The XRP/USD pair continues to trade within a long-term downward channel.

Last week, the token price dropped to the area of 0.5859, where it is now consolidating. The breakdown of this level allows further decline to the levels of 0.4883 and 0.3906. The key “bullish” area is the resistance zone of 0.7812–0.75. Its breakout allows growth to the levels of 0.91 and 0.9766.

In general, the downward trend in the market continues, which is confirmed by a downward reversal of Bollinger bands and an increase in the MACD histogram in the negative zone. However, the upward reversal of Stochastic from the oversold zone does not exclude a corrective growth of the Ripple to the area of 0.75 but is unlikely to break the current downtrend.

Support and resistance
Resistance levels: 0.75, 0.7812, 0.91, 0.9766.
Support levels: 0.5859, 0.4883, 0.3906.​

xrp_1.png
 
GBPUSD Technical Analysis

The British currency demonstrates upward trading dynamics during the morning session on January 26, recovering from local lows of the beginning of the month and testing for a breakout the strong resistance around 1.35. The growth is more of a technical nature since the fundamental factors change slightly.

Bollinger bands smoothly reverse downwards on the daily chart. The price range expands from below, letting the "bears" renew local lows. MACD also decreases, keeping a strong sell signal the histogram is below the signal line. Having approached its lows, Stochastic reversed into an upward plane, signaling in favor of a corrective growth of the pound in the ultra-short term.

Resistance levels: 1.35, 1.355, 1.36, 1.365.
Support levels: 1.346, 1.3435, 1.34, 1.335.​

gbpusd_1.pnggbpusd_2.png
 
EUR/USD
US Fed meeting results determine the dynamics of the pair

Current trend

This week, the EUR/USD pair actively fell due to the strengthening of the American currency, currently trading around 1.129.

The dollar is rising as investors await the outcome of the first meeting of the US Federal Reserve this year, which will end today. It is predicted that officials of the department will leave the rate at the same level in January but will announce their readiness to raise it in March. Most experts believe that to combat inflation, which was fixed at 7.0% for December, the regulator may need four or more adjustments this year. Another issue will be the reduction of the department's balance sheet, which has more than doubled during the pandemic. Most likely, the process will be launched as early as May or June after completing the emergency asset purchase program. In general, the market is tuned to the "hawkish" rhetoric of the US Federal Reserve, which, in turn, should contribute to further strengthening of the US currency but may create additional pressure on the stock market.


Support and resistance
The consolidation below 1.1290 allows the EUR/USD pair to decrease to 1.1230 - 1.1185 . The key "bullish" level is 1.1350, Fibonacci correction, 23.6%, the middle line of Bollinger bands, which breakout will become a catalyst for upward dynamics to the area of 1.1470 , Fibonacci correction 38 .2%. The indicators do not give a single signal: Bollinger bands are horizontal, the MACD histogram is near the zero line, its volumes are insignificant, and Stochastic reverses upwards.

Resistance levels: 1.1350, 1.1413, 1.1475.
Support levels: 1.1290, 1.1230, 1.1185.​

eurusd.png
 
USD/CAD
Decline under pressure from rising oil prices

Current trend

After the USD/CAD pair couldn't break the resistance level of 1.2650, it resumed its downward dynamics to 1.2500. The pressure on the asset is exerted by the growth of quotations for WTI Crude Oil, which reached $86 per barrel. Further strengthening of the oil prices to 90.00 will contribute to the continued decline of the USD/CAD pair and allow the "bears" to reach the level of 1.2500.

The long-term trend in the USD/CAD pair is upwards. At the moment, a correction is developing, and the breakdown of 1.2500 allows reaching the key support near 1.2295.

The medium-term trend is downwards. This week, the pair corrected to the key resistance 1.2706–1.2683, which allowed the "bulls" to close positions at favorable prices, and the "bears" — to form new sales with the targets at the last week's lows. The breakout of the key resistance of the trend allows growth to the target zone 2 (1.2950–1.2926).

Support and resistance
Resistance levels: 1.2650, 1.2850, 1.2936.
Support levels: 1.2500, 1.2295, 1.2161.​
 

Attachments

  • usdcad_1.png
    usdcad_1.png
    19.6 KB · Views: 0
  • usdcad_2.png
    usdcad_2.png
    21.9 KB · Views: 0
Brent Crude Oil
Further price growth is in the future

Current trend

Quotes of Brent Crude Oil are consolidating around 87.50, but they still cannot consolidate above it, despite active attempts. Short-term support for the asset was provided by a report published by the American Petroleum Institute (API), which reflected a reduction in US inventories by 0.872M barrels, significantly exceeding the market's expected to decline by 0.400M barrels.

In the long term, oil prices are strengthening due to geopolitical tensions in the Middle East and Ukraine. The infrastructure of the leading oil producers in Saudi Arabia and the United Arab Emirates is still under the threat of Yemeni Houthi missile attacks, which threatens to disrupt the oil supply to the market. The last attack took place on Monday but did not have serious consequences. Also, the increase in geopolitical tension around Ukraine, and even more so the start of an open military conflict, can lead to interruptions in the supply of oil and gas to consumers. The negative outlook also supports global energy prices, but their serious growth is hindered by today's US Federal Reserve meeting on monetary policy. The regulator may announce an adjustment to the existing parameters, strengthening the dollar and putting pressure on the oil market.

Support and resistance
Resistance levels: 87.50, 90.60, 93.75.
Support levels: 83.50, 81.25, 78.12.​

oil.png
 
Back
Top