Tifia Forex Broker Daily Market Analytics, Analytics and trading recommendations by Tifia Company

AUD/USD: RBA is ready to lower rates
12/17/2019

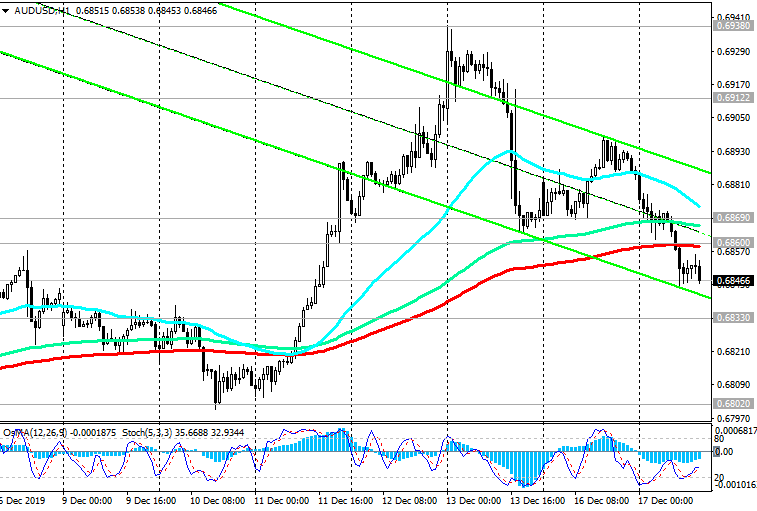
The AUD / USD pair broke on Tuesday an important short-term support level of 0.6860 (ЕМА200 on the 1-hour chart) and is developing a downward movement, returning to the global down-trend.
Following a meeting in December, the RBA left the key interest rate unchanged, at a record low of 0.75%.
Concerns about a sharp slowdown in global economic growth have become one of the main reasons that prompted the RBA to lower interest rates this year. According to the text of the minutes of the meeting of the RBA held on December 3, which were published earlier on Tuesday, the bank's management in February intends to reassess the prospects of monetary policy.
RBA Governor Philip Lowe spoke about the "emerging turning point" in the economy. However, the published RBA protocols indicated that the bank was ready to lower rates again if necessary.
Weak GDP growth in the 3rd and 4th quarters, remaining low personal consumption and weak retail sales reinforce expectations of a further reduction in interest rates at a meeting of the Reserve Bank of Australia on February 4. This will put downward pressure on AUD.
AUD / USD is trading below important resistance levels 0.6912 (ЕМА200 on the daily chart), 0.6869 (ЕМА144 on the daily chart).
In the event of a breakdown of the local support level of 0.6802 and a further decrease, the targets will be the support levels of 0.6670 (2019 lows), 0.6600.
Below resistance level 0.6860, short positions are preferred.
Support Levels: 0.6833, 0.6802, 0.6745, 0.6700, 0.6670, 0.6600, 0.6300
Resistance Levels: 0.6860, 0.6869, 0.6912, 0.6938

Trading Recommendations

Sell by market. Stop-Loss 0.6870. Take-Profit 0.6833, 0.6802, 0.6745, 0.6700, 0.6670, 0.6600, 0.6300
Buy Stop 0.6870. Stop-Loss 0.6810. Take-Profit 0.6900, 0.6910
171219-AU-D.png

171219-AU-H1.png

*) For up-to-date and detailed analytics and news on the forex market visit Tifia Forex Broker website tifia.com
 
NZD/USD: Current Dynamics
12/18/2019

After the release of weak data from a dairy auction organized by the New Zealand company Fonterra (a specialized trading platform GlobalDairyTrade - GDT) and amid the strengthening of the US dollar, the NZD / USD pair fell. The Dairy Price Index prepared by Global Dairy Trade came out last Tuesday with a value of -5.1% (against the forecast of +0.5% and after a decrease of -0.5% in the previous 2-week period).
News of the achievement of an intermediate trade deal between the US and China contributed to the growth of world stock indices and commodity quotes at the beginning of the week.
US economic data has also recently eased concerns about a sharp slowdown in global economic growth.
At the same time, many investors in the commodity market are cautious because of the abundant supply and continuing risks of an unsuccessful outcome of the upcoming trade negotiations between the US and China. All details of the interim agreement, which has not yet been officially translated and has not been signed, are not yet clear.
Some participants in the foreign exchange market consider the current growth in commodity currencies excessive in the framework of the global downtrend, and the closure of long positions may strengthen the rally in the coming days. In particular, this applies to the New Zealand dollar.
So far, the NZD / USD pair remains positive dynamics, trading in the upward channel on the daily chart above the important support level of 0.6519 (EMA200 on the daily chart).
A breakdown of the local resistance level of 0.6575 can be a signal for continued purchases and an increase in NZD / USD towards the local maximum of 0.6635 and the upper border of the ascending channel on the daily chart and further to the key resistance levels of 0.6770 (EMA144 on the weekly chart), 0.6865 (EMA200 on the weekly chart and Fibonacci level 23.6% of the correction in the global wave of pair decline from the level of 0.8820).
An alternative scenario will be associated with the breakdown of the support level of 0.6565 (EMA200 on the 1-hour chart, EMA50 and the bottom line of the ascending channel on the 4-hour chart), which can trigger a decline to the support level of 0.6519 and further to the support level of 0.6485 (EMA200 on the 4-hour chart, ЕМА144 and the bottom line of the ascending channel on the daily chart). A further decline will indicate a resumption of the NZD / USD global downtrend.
Support Levels: 0.6565, 0.6555, 0.6519, 0.6485, 0.6440, 0.6400, 0.6322, 0.6260, 0.6200, 0.6100
Resistance Levels: 0.6575, 0.6635, 0.6770, 0.6865

Trading Scenarios

Sell Stop 0.6550. Stop-Loss 0.6585. Take-Profit 0.6519, 0.6485, 0.6440, 0.6400, 0.6322, 0.6260, 0.6200, 0.6100
Buy Stop 0.6585. Stop-Loss 0.6550. Take-Profit 0.6635, 0.6770, 0.6865
181219-NU-W.png

181219-NU-D.png

181219-NU-H1.png

*) For up-to-date and detailed analytics and news on the forex market visit Tifia Forex Broker website tifia.com
 
GBP/USD: Bank of England rate decision
12/19/2019

Today at 12:00 (GMT) the decision of the Bank of England on the interest rate will be published. Due to the importance of today's event, a sharp increase in volatility is expected at this time in the foreign exchange market, especially in pound quotes.
GBP / USD broke through an important support level of 1.3210 on Tuesday (Fibonacci level 23.6% of the correction to the GBP / USD decline in a wave that began in July 2014 near the level of 1.7200) and a short-term support level of EMA200 on the 1-hour chart.
In case of further decline, the immediate goal will be the support level of 1.3010 (ЕМА200 on the 4-hour chart).
The Bank of England is expected to maintain its monetary policy today unchanged. However, it may signal the possibility of lowering the key interest rate in the coming months.
Inflation remains weak, well below the target level of 2%, and the fiscal stimulus measures promised by the UK government aimed at ensuring robust economic growth are unlikely to be implemented soon.
Media reports that conservatives rule out a transitional extension for Brexit could hurt the recovery of investment after the election and increase the risk of a tough Brexit.
In addition, the threat of a new referendum on Scottish independence is growing.
Given all these negative factors, the Bank of England may be forced to soften its monetary policy in the coming months.

The return of GBP / USD to the zone below the support level of 1.2750 (EMA200 on the daily chart) will indicate the resumption of the bearish trend. In case of breakdown of the support level of 1.2750, the aim of lowering for the next 3-4 months will be the support level of 1.2000 (2017 lows and the Fibonacci level of 0%).
A signal for the implementation of an alternative scenario will be a growth into the zone above the resistance level of 1.3210.
Support Levels: 1.3100, 1.3010, 1.2750
Resistance Levels: 1.3172, 1.3210, 1.3340, 1.3510, 1.3960, 1.4350, 1.4580, 1.5080, 1.5190

Trading Scenarios

Sell Stop 1.3190. Stop-Loss 1.3260. Take-Profit 1.3100, 1.3000, 1.2745, 1.2700, 1.2665, 1.2620, 1.2470, 1.2400, 1.2200, 1.2175, 1.2150, 1.2100, 1.2000
Buy Stop 1.3520. Stop-Loss 1.3290. Take-Profit 1.3600, 1.3960, 1.4350, 1.4580, 1.5080, 1.5190
191219-GU-D.png

191219-GU-H1.png

*) For up-to-date and detailed analytics and news on the forex market visit Tifia Forex Broker website tifia.com
 
USD/CAD: so far, correction after the fall
12/20/2019

After a many-day decline, the USD / CAD pair entered the correctional phase on Thursday. The weakening Canadian dollar was contributed by the disappointing macro statistics on wholesale trade and supplies to the manufacturing sector of the Canadian economy.
According to the National Bureau of Statistics Canada, the volume of wholesale trade in October fell sharply (-1.1%). The data for the previous month were revised downward, to +0.8% versus +1.0% earlier.
At the same time, supplies in the manufacturing sector in October fell for the second month in a row (-0.7%) after falling in September by -0.2%.
The Canadian dollar reacted negatively to the publication of the data.
The Canadian dollar still maintains a positive trend against the US dollar. However, a number of negative macro data from Canada this week could stop the fall of the USD / CAD pair. If positive news about the state of the US economy comes from the US, then the growth of the USD and the pair USD / CAD will resume.
Today at 13:30 (GMT) Statistics Canada will publish the retail sales index, which is often considered an indicator of consumer confidence and reflects the state of the retail sector in the near future. Index growth is usually a positive factor for CAD; a decrease in the indicator will negatively affect CAD.
If data for October is weaker than the previous value (-0.1%) or forecast (+0.5%), then CAD may drop sharply, given the release of weak macro data on wholesale trade and supplies in Canada’s manufacturing sector earlier this week.
Thus, at 13:30 (GMT) an increase in volatility is expected in the USD and CAD quotes, and, accordingly, in the USD / CAD pair.
In the last 2 days, the USD / CAD pair has been rising after a strong fall before. Breakdown of the short-term resistance level 1.3165 (ЕМА200 on the 1-hour chart) will be a signal for the resumption of long positions. Above the key resistance level of 1.3230 (EMA144 and EMA200 on the daily chart), long positions will again be preferred.
In an alternative scenario and in case of breakdown of the support levels 1.3140 and 1.3345, and the lower border of the upward channel on the daily chart, passing near the mark 1.3100, and of further decline, USD / CAD will go to support levels 1.3042, 1.3015, corresponding to annual minimums. A decline into the zone below the support level of 1.2920 (EMA200 on the weekly chart) will indicate a break in the bullish trend of USD / CAD.
Support Levels: 1.3100, 1.3060, 1.3042, 1.3015
Resistance Levels: 1.3140, 1.3165, 1.3205, 1.3230, 1.3300, 1.3325, 1.3345, 1.3380, 1.3400, 1.3435

Trading Scenarios

Sell Stop 1.3115. Stop-Loss 1.3150. Take-Profit 1.3100, 1.3060, 1.3042, 1.3015
Buy Stop 1.3150. Stop-Loss 1.3115. Take-Profit 1.3165, 1.3205, 1.3230, 1.3300, 1.3325, 1.3345, 1.3380, 1.3400, 1.3435
201219-UCD-D.png

201219-UCD-H1.png

*) For up-to-date and detailed analytics and news on the forex market visit Tifia Forex Broker website tifia.com
 
XAU/USD: Current Dynamics
12/23/2019

After the publication of data on US GDP last Friday, according to which in the 3rd quarter annual growth amounted to 2.1%, and data on personal income / expenses of the Americans, the dollar strengthened and gold futures declined.
According to the US Department of Commerce, personal consumption expenditures (household expenses) in November increased by 0.4% compared with October. At the same time, personal income of Americans over this period increased by 0.5%. Expenditure on durable goods increased by 1%. Rising wages and lowering unemployment to 50-year lows stimulated consumer spending this year, which in turn supported the US economy.
Gold prices are under pressure from the stabilization of the US economy and amid progress in the course of trade negotiations between Washington and Beijing.
And yet, the dollar still can not develop upward momentum at a faster pace, and at the beginning of the new week, the DXY dollar index is falling. Washington and Beijing are expected to sign an interim trade agreement (of “first phase”) in January, but the uncertainty about the details of the deal adds uncertainty to the ranks of buyers of risky assets and supports safe haven assets.
U.S. political uncertainty surrounding President Donald Trump’s impeachment, which was announced by the House of Representatives on Wednesday, also boosts gold prices at the start of a new Christmas week.
The pair XAU / USD is trading at the beginning of the European session near the mark of 1484.00, which corresponds to 6-week highs.
Above the support levels of 1450.00, 1428.00 (EMA200 on the daily chart), the long-term positive dynamics of XAU / USD remains. A break into the zone above the resistance level of 1484.00 (Fibonacci level 50% of the correction to the wave of decline from September 2011 and the mark of 1920.00) will resume the bullish trend XAU / USD.
In an alternative scenario, the breakdown of the short-term support level of 1475.00 (EMA200 on the 1-hour chart, EMA50 on the daily chart) will be a signal for XAU / USD sales with targets at the support levels of 1450.00, 1428.00.
From the news for today it is worth paying attention to the publication at 13:30 (GMT) of a block of macro data from the United States, including data on orders for capital goods for November. The indicator reflects the value of orders received by manufacturers of capital goods, implying large investments. Forecast for November: -0.3%. The dollar is likely to decline after the publication of data. Data better than forecast will strengthen the dollar in the short term.
Support Levels: 1475.00, 1450.00, 1428.00, 1380.00, 1368.00, 1310.00, 1253.00
Resistance Levels: 1484.00, 1497.00, 1520.00, 1535.00, 1555.00, 1585.00

Trading Recommendations

Sell Stop 1469.00. Stop-Loss 1487.00. Take-Profit 1450.00, 1428.00
Buy Stop 1487.00. Stop-Loss 1469.00. Take-Profit 1497.00, 1520.00, 1535.00, 1555.00, 1585.00
231219-XU-D.png

231219-XU-H1.png

*) For up-to-date and detailed analytics and news on the forex market visit Tifia Forex Broker website tifia.com
 
S&P500: positive dynamics continues
12/24/2019

Major US stock indices Dow Jones Industrial Average, Nasdaq Composite and S&P 500 finished trading last Monday at historic highs.
After futures for US stock indexes continued on Monday the recent series of growth, today they are trading in a very narrow range: S&P 500 - near 3225.0, Nasdaq100 - near 8702.0, DJIA - near 28570.0.
The S&P500 index maintains long-term positive dynamics, trading above key support levels of 2978.0 (ЕМА200 on the daily chart), 3018.0 (ЕМА144 on the daily chart and Fibonacci level 23.6% of the correction to the growth since December 2018 and 2335.0).
Probably, after the breakdown of the local resistance level 3229.0, the S&P500 will continue to grow.
In an alternative scenario and after the breakdown of support levels 3193.0 (ЕМА200 on the 1-hour chart), 3135.0 (ЕМА200 on the 4-hour chart) S&P500 will go to support levels 3018.0, 2978.0. Long positions are preferred so far.
Trading volume on European and American stock markets today will be small. Most exchanges are either closed or shut down early on the eve of the holiday. Market volatility will return on December 26 - 27, and will fully recover after the New Year holidays.
Support Levels: 3193.0, 3157.0, 3135.0, 3100.0, 3018.0, 2978.0
Resistance Levels: 3229.0

Trading recommendations

Sell Stop 3190.0. Stop-Loss 3131.0. Goals 3157.0, 3135.0, 3100.0, 3018.0
Buy Stop 3131.0. Stop-Loss 3190.0. Goals 3200.0, 3250.0
241219-s500-D.png

241219-s500-H1.png

*) For up-to-date and detailed analytics and news on the forex market visit Tifia Forex Broker website tifia.com
 
DJIA: rally may continue in the new year
12/26/2019

The US stock market is dominated by positive dynamics. US stock indexes end the year with the best results in the last 6 years. The S&P 500 gained almost 29% this year, DJIA - 24%, moreover, shares rose in almost all sectors.
Investors are also mostly optimistic about the prospects for the stock market in 2020.
In Europe and some other countries continue to celebrate Christmas. Trading volumes are likely to recover after January 6th.
Meanwhile, the uncertainty about the details of the deal between the US and China is fueling some uncertainty among investors. At the same time, the exact form of future trade relations between the UK and the EU is unclear. In addition, the risk of another Scottish independence referendum is growing.
Expectations of further growth in stock indices speak in favor of DJIA purchases.
In an alternative scenario, after the breakdown of the short-term support level of 28330.0 (ЕМА200 on the 1-hour chart) and in case of resumption of decline, the targets will be support levels 27950.0 (ЕМА200 on the 4-hour chart), 27100.0 (ЕМА144 on the daily chart), 26800.0 (ЕМА200 on the daily chart )
The breakdown of support level 26800.0 may provoke a further decrease to support levels 25500.0 (Fibonacci level of 23.6% of the correction to the DJIA growth wave, which began in February 2016 from the level of 15500.0), 25270.0 (August lows), 24600.0 (June 2019 lows).
Stronger decline in the DJIA will require convincing evidence of a slowdown in the US economy and a worsening trade conflict between the US and China.
In the meantime, there is the long-term positive dynamics of US stock indices and the DJIA index, including.
Support Levels: 28330.0, 27950.0, 27400.0, 27100.0, 26800.0, 25550.0
Resistance Levels: 28585.0

Trading Scenarios

Buy Stop 28650.0. Stop-Loss 28300.0. Take-Profit 29000.0, 30000.0
Sell Stop 28300.0. Stop-Loss 28650.0. Take-Profit 27950.0, 27400.0, 27100.0, 26800.0, 25550.0
261219-DJIA-W.png

261219-DJIA-D.png

261219-DJIA-H1.png

*) For up-to-date and detailed analytics and news on the forex market visit Tifia Forex Broker website tifia.com
 
Brent: Strong positive momentum
12/27/2019

A strong positive momentum of a fundamental nature, observed on world stock markets and the oil market, is pushing prices to new 3-month highs.
The price broke through at the beginning of the month the key resistance level 63.90 (EMA200 on the daily chart and the Fibonacci level 38.2% of downward correction in the wave of price growth from the level near the level of 27.10 to the highs of October 2018 near the level of 86.60) and continues to develop upward trend in side of the local maximum 69.70.
In the case of a breakthrough of this resistance level, the next growth target will be the resistance level 72.60 (Fibonacci level of 23.6% and the upper border of the ascending channel on the weekly chart).
The positive mood of investors is fueled by hopes that the US and China will reach an agreement of the "first phase" in January. Earlier this month, OPEC and other oil producing countries, including Russia, agreed on an additional cumulative cap on production of 500,000 barrels per day in order to reduce global supply.
Following the results of three meetings, the Fed lowered interest rates this year, and in October the range of key interest rates was 1.5% - 1.75%. At the same time, in December, Fed leaders said that monetary policy was likely to remain unchanged in the next 2020.
The stock market euphoria, despite the political instability in some regions of the world, also contributes to the growth of oil prices.
Thus, a favorable external background is forming for the possibility of further growth in the oil market.
In an alternative scenario, the signal for the resumption of sales will be a breakdown of the support level of 66.40 (ЕМА200 on the 1-hour chart).
The breakdown of the support levels 63.90, 63.00 will mean the resumption of the global downtrend with support at the levels of 60.40 (May lows), 58.50, 56.90 (Fibonacci level of 50%).
From the news today, we are waiting for the publication by the US Department of Energy at 15:30 (GMT) weekly data on stocks of oil and petroleum products. According to the forecast, it is expected that they decreased by 1.724 million barrels last week. When confirmed, oil is likely to continue to rise in price. Also, today (at 18:00 GMT) the next weekly report of the American oilfield services company Baker Hughes will be published. If the report indicates a decrease in the number of active drilling rigs, this may give an additional positive impetus to prices.
Support Levels: 67.50, 66.40, 64.50, 63.90, 63.00, 61.00, 60.40, 58.50, 56.90
Resistance Levels: 68.00, 69.70, 72.60

Trading Recommendations

Sell Stop 67.40. Stop-Loss 68.20. Take-Profit 66.40, 64.50, 63.90, 63.00, 61.00, 60.40, 58.50, 56.90
Buy Stop 68.20. Stop-Loss 67.40. Take-Profit 69.70, 71.00, 72.00, 72.60
271219-Brent-D.png

271219-Brent-H1.png

*) For up-to-date and detailed analytics and news on the forex market visit Tifia Forex Broker website tifia.com
 
DJIA: investor optimism pushes indices up
12/30/2019

Positive dynamics prevail in the global stock market. The main factor contributing to the growth of indices in recent days is both the traditional New Year rally and the expectation of the signing of the first part of the US-China trade agreement in January. If this happens, it should give the world economy an impetus for growth. Nevertheless, there remains a lot of ambiguity regarding the future prospects of trade relations between the two countries, whose total GDP is about 35% of total world GDP. The details of the agreement were not disclosed, so it remains unclear what will happen if the parties fail to resolve the remaining contradictions.
Investors are also mostly optimistic about the prospects for the stock market in 2020. Expectations of further growth in stock indices speak in favor of DJIA purchases.
In an alternative scenario, after the breakdown of the short-term support level
28450.0 (ЕМА200 on the 1-hour chart) and in case of further decrease in DJIA, the targets will be the support levels 28030.0 (ЕМА200 on the 4-hour chart), 27100.0 (ЕМА144 on the daily chart), 26850.0 (ЕМА200 on the daily chart).
The breakdown of support level 26800.0 may provoke a further decline to support levels 25600.0 (Fibonacci level 23.6% of the correction to the DJIA growth wave, which began in February 2016 from 15500.0), 25270.0 (August lows), 24600.0 (June 2019 lows).
Stronger decline in the DJIA will require convincing evidence of a slowdown in the US economy and a worsening trade conflict between the US and China.
In the meantime, there is the long-term positive dynamics of US stock indices and the DJIA index, including.
Support Levels: 28450.0, 28030.0, 27400.0, 27100.0, 26850.0, 25600.0
Resistance Levels: 28730.0

Trading Scenarios

Buy Stop 28750.0. Stop-Loss 28430.0. Take-Profit 29000.0, 30000.0
Sell Stop 28430.0. Stop-Loss 28750.0. Take-Profit 28030.0, 27400.0, 27100.0, 26850.0
301219-DJIA-D.png

301219-DJIA-H1.png

*) For up-to-date and detailed analytics and news on the forex market visit Tifia Forex Broker website tifia.com
 
USD/CAD: US dollar resumed growth
09/01/2020
Current Dynamics

Against the backdrop of the weakening US dollar, the USD / CAD pair broke through the key support level 1.3205 (EMA144 and EMA200 on the daily chart) last month and reached 1.2957 in early January. Further decline and breakdown of the long-term support level of 1.2930 (EMA200 on the weekly chart) would mean breaking the bullish trend of USD / CAD.
Nevertheless, there was no further decrease in USD / CAD and today the pair has been growing for the third day in a row.
The pair’s growth is facilitated by both the strengthening of the US dollar and the decline in oil prices that followed after their significant increase on the eve amid a sharp aggravation of the geopolitical situation in the Middle East. As you know, on Tuesday night, Iran launched a missile attack on US military bases in Iraq.
However, as follows from the statements of the White House, none of the US military was injured.
In turn, the Iranian Foreign Minister tweeted that the missile attacks were not intended to escalate the conflict or start a war.
The words of US President Trump that "everything is fine", and Iran, it seems, does not intend to continue the conflict, reassured investors, which helped to renew the rally of US stock indices and the USD.
USD / CAD broke through the short-term resistance level 1.3027 on Wednesday (EMA200 on the 1-hour chart), which was the first signal to resume long positions, and is trading on Thursday near the local resistance level 1.3050 (October lows).
If the growth continues, USD / CAD will go to the resistance level 1.3120 (ЕМА200 on the 4-hour chart), and in case of breakdown, the growth will accelerate to the key resistance level 1.3205.
The December report of the US Ministry of Labor will be published on Friday. Economists expect jobs to reach +160,000, while unemployment remains at 3.5%, as in November.
Also, on Friday at the same time (at 13:30 GMT) will be published data from the Canadian labor market. In December, Canada's unemployment rate is expected to be 5.8%. This is slightly better than the November figure, but still worse than the average for 2019 (about 5.6% - 5.7%). Growth in unemployment is a negative factor for the national currency. If the data turn out to be worse than the forecast of 5.8%, then the Canadian dollar will drop sharply, and the growth of USD / CAD will continue.
In an alternative scenario and after the breakdown of the short-term support level 1.3027 (ЕМА200 on the 1-hour chart), short positions will again become relevant.
Nevertheless, in this period of time (13:30 GMT) on Friday, a sharp increase in volatility in the foreign exchange market is expected, and above all - in the pair USD / CAD.
From the news today it is worth paying attention to the speech at 19:00 (GMT) of the head of the Bank of Canada Stephen Poloz. If in his speech today he touches on the topic of monetary policy, the volatility of Canadian dollar quotes will increase. If Stephen Poloz speaks out in favor of the need for a softer monetary policy of the Bank of Canada, then the weakening of the Canadian dollar and the growth of USD / CAD will accelerate.
Support Levels: 1.3027, 1.3000, 1.2960, 1.2930
Resistance Levels: 1.3050, 1.3120, 1.3205, 1.3300, 1.3325, 1.3345, 1.3380, 1.3400, 1.3452

Trading Scenarios

Sell Stop 1.3025. Stop-Loss 1.3065. Take-Profit 1.3000, 1.2960, 1.2930
Buy Stop 1.3065. Stop-Loss 1.3025. Take-Profit 1.3120, 1.3205, 1.3300, 1.3325, 1.3345, 1.3380, 1.3400, 1.3452
090120-UCD-W.png

090120-UCD-D.png

090120-UCD-H1.png

*) For up-to-date and detailed analytics and news on the forex market visit Tifia Forex Broker website tifia.com
 
Back
Top