AceTraderFx April 4: Daily Technical Outlook on Major –GBP/USD

acetraderfx

AceTrader.com Representative
Messages
1,109
DAILY TECHNICAL OUTLOOK ON GBP/USD
Last Update At 04 Apr 2014 00:18GMT

Trend Daily Chart
Sideways

Daily Indicators
Neutral

21 HR EMA
1.6602

55 HR EMA
1.6617

Trend Hourly Chart
Near term down

Hourly Indicators
Rising fm o/s

13 HR RSI
43

14 HR DMI
-ve

Daily Analysis
Consolidation with downside bias

Resistance
1.6684 - Mon's high
1.6665 - Wed's high
1.6619 - Tue's low

Support
1.6570 - Y'day's low
1.6555 - Last Thur's low
1.6509 - Last Wed's low


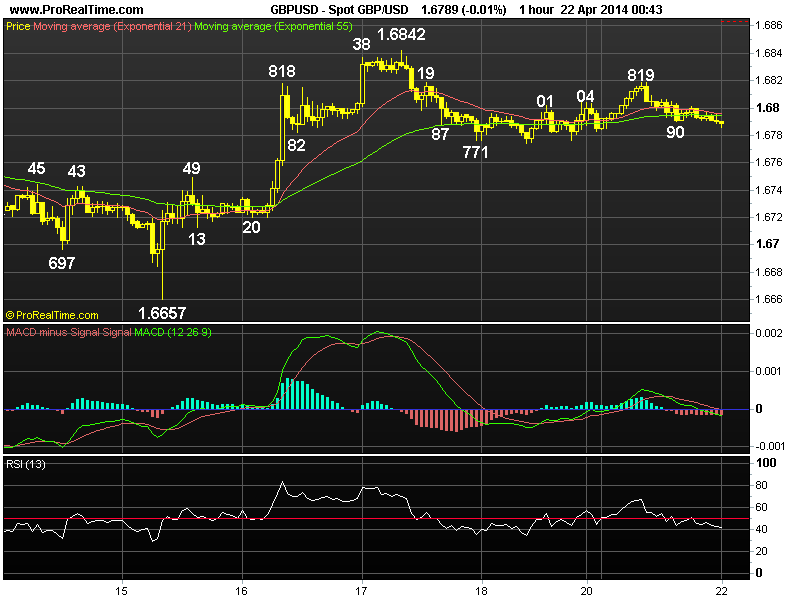
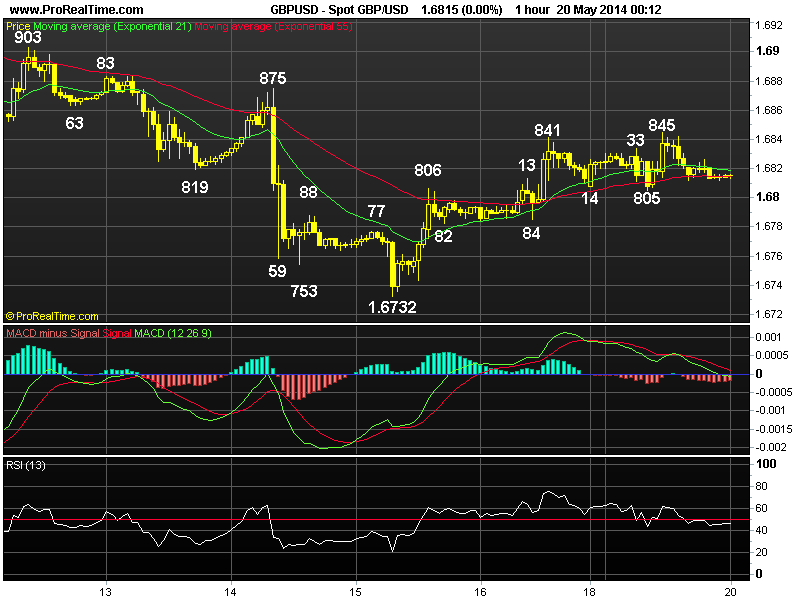
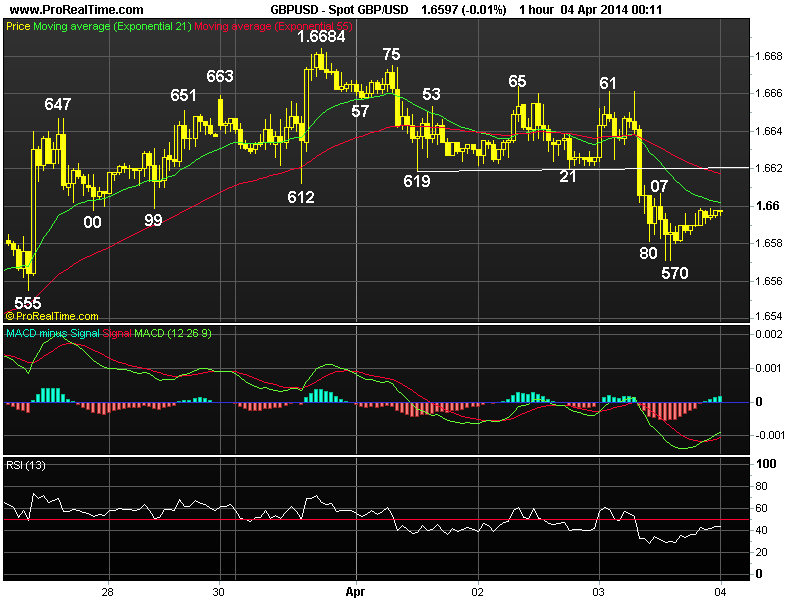
. GBP/USD - 1.6597... Despite trading just abv Tue's 1.6619 low y'day at Asian open, hawkish comments by BoE Governor Carney reported on BLP sent price higher to 1.6661 b4 easing to 1.6625. Cable re-tested 1.6661 in Europe but fell on downbeat U.K. services PMI. Selloff in eur/usd knocked cable to 1.6570 in NY.

. Looking at the broader picture, y'day's anticipated decline has retained
our daily bearish technical outlook on cable. Although the erratic rise fm last
Mon's 1.6460 low confirms the 1st leg of correction fm Feb's 4 year peak at
1.6823 has ended there, as price has faltered right at the indicated 'dynamic'
res at 1.6684 (being 61.8% r of 1.6823-1.6460), cable's selloff to 1.6570 Thur signals correction is over. A daily close below 1.6555 sup anytime wud encourage for a re-test of 1.6460 next week, break wud confirm downtrend fm 1.6823 has finally resumed n yield weakness twd 1.6321 (equality projection of 1.6823-1.6460 measured fm 1.6684, later this month.

. Today, as cable has traded well abv 1.6570 in NY afternoon, suggesting
consolidation wud continue in Asia n we may need to wait for U.S. payrolls data b4 prospect of another fall. Only abv 1.6619/21 risks 1.6661/65, break, 1.6684.

GBP%20apr%2004.png
 
Last edited by a moderator:
AceTraderFx Apr 22: Daily Technical Outlook on Major – GBP/USD

DAILY TECHNICAL OUTLOOK ON GBP/USD
Last Update At 22 Apr 2014 00:40GMT

Trend Daily Chart
Up

Daily Indicators
Bearish divergences

21 HR EMA

1.6794

55 HR EMA
1.6796

Trend Hourly Chart
Sideways

Hourly Indicators
Falling

13 HR RSI
42

14 HR DMI
-ve

Daily Analysis
Consolidation with downside bias

Resistance
1.6879 - 2009 high (Nov)
1.6842 - Last Thur's high
1.6819 - Y'day's high

Support
1.6771 - Last Fri's low
1.6749 - Last Tue's high
1.6713 - Last Tue's NY sup


. GBP/USD - 1.6789 ... Although the pound traded with a steady tone at Mon
open y'day, broad-based buying of sterling helped price to ratchet higher fm
last Fri's 1.6771 low (Reuters) to intra-day peak of 1.6819 b4 coming off in NY
due to euro's weakness, cable later retreated to 1.6790, then 1.6786 today.

. Looking at the hourly and daily charts, as last week's 4-1/2 year high at
1.6842 high was accompanied by bearish divergences on the hourly indicators, sub
sequent retreat suggests a temporary top has been made n initial consolidation
with downside bias is seen, however, break of 1.6657 sup is needed to violate
recent series of higher lows n higher highs n signal the long-awaited correction
has taken place, then cable wud head twd 1.6554. On the upside, abv 1.6842 wud
extend MT upmove fm 1.4228 (2010 bottom) to 1.6879 (Nov 2009 high) n possibly
twd 1.6945, being 50% projection of the MT intermediate rise fm 1.5854-1.6823
measured fm 1.6460, bearish divergences on daily indicators shud cap price
below key res 1.7044 (Aug 2009 peak - reaction high fm 2009 low at 1.3500).

. Today, as long as 1.6819 holds, downside bias remains, below 1.6771 wud
yield weakness to 1.6747/49 n only abv 1.6819 may risk re-test of 1.6842.

GBP%20apr%2022.png
 
Last edited by a moderator:
AceTraderFx Apr 30: Daily Technical Outlook on GBP/USD

DAILY TECHNICAL OUTLOOK ON GBP/USD
Last Update At 30 Apr 2014 00:40GMT

Trend Daily Chart
Up

Daily Indicators
Rising

21 HR EMA
1.6823

55 HR EMA
1.6817

Trend Hourly Chart
Sideways

Hourly Indicators
Neutral

13 HR RSI
51

14 HR DMI
+ve

Daily Analysis
Consolidation with downside bias

Resistance
1.6945 - 50% proj. of 1.5854-1.6823 fm 1.6460
1.6879 - 2009 high (Nov)
1.6858 - Mon's fresh 4-1/2 year high

Support
1.6792 - Y'day's NY low
1.6762 - Last Wed's low
1.6713 - Apr 15 NY low


. GBP/USD - 1.6825... Cable went through a 'roller-coaster' session on Tue. Although price rose briefly to 1.6847 in early Europe n then tumbled to 1.6792 after release of disappointing U.K. Q1 GDP data, price rebounded on active buying of pound vs euro n rose 1-tick higher to 1.6848 in NY morning b4 easing.

. Although cable's rebound fm y'day's low at 1.6792 to 1.6848 suggests 1st leg of correction fm Mon's fresh 4-1/2 year peak at 1.6858 has ended there n another day of choppy sideways swings is envisaged, as long as 1.6858 top holds, downside bias remains for another attempt twd chart obj. at 1.6762 (last week's low), however, a daily close below there is needed to confirm a temporary top has been formed n yield stronger retracement to 1.6710/20. On the upside, abv said high anytime wud confirm MT uptrend fm 1.4228 (2010 bottom) has once again resumed n further gain to 1.6879 (Nov 2009 high) wud follow, however, prominent 'bearish divergences' on hourly oscillators on next upmove shud cap price below 1.6945 (50% projection of 1.5854-1.6823 measured fm 1.6460, n bring correction.

. In view of abv analysis, we're selling cable again on recovery n only abv
minor daily res at 1.6879 wud risk marginal gain to 1.6900/05 b4 retrace. occur.
GBP%20apr%2030.png
 
Last edited by a moderator:
AceTraderFx May 7: Daily Technical Outlook on GBP/USD

DAILY TECHNICAL OUTLOOK ON GBP/USD
Last Update At 07 May 2014 00:33GMT

Trend Daily Chart
Up

Daily Indicators
Rising

21 HR EMA
1.6857

55 HR EMA
1.6821

Trend Hourly Chart
Up

Hourly Indicators
Easing fm o/bot

13 HR RSI
68

14 HR DMI
+ve

Daily Analysis
Resumption of MT uptrend

Resistance
1.7103 - 1.236 ext. of 1.6460-1.6821 fm 1.6657
1.7044 - Aug 2009 high
1.7000 - Psychological res

Support
1.6954 - Y'day's European morning high, now sup
1.6921 - Last Thur's high, now sup
1.6887 - Hourly chart


. GBP/USD - 1.6978
... Cable edged higher after meeting renewed buying at 1.6865 in Australia y'day n price climbed ahead of European open on dlr's broad-based weakness. Later, release of upbeat UK service PMI pushed price abv 1.6921 to 1.6954, then later to a fresh near 5-year peak of 1.6996 in NY b4 easing.

. Looking at the hourly n daily charts, cable's firmness after y'day's rally abv last Thur's high at 1.6921 (now sup) to 1.6996 confirms MT erratic uptrend fm 1.4228 (2010 bottom) has once again resumed n further gain is envisaged after a minor consolidation, abv psychological res at 1.7000 wud encourage further headway twd ket res at 1.7044 (Aug 2009 peak n reaction high fm 2009 record low at 1.3500), however, as hourly oscillators are in o/bot territory, sharp gain is unlikely to be seen n reckon 1.7103, (1.236 times extension of 1.6460-1.6821 fm 1.6657) wud remain intact this week n yield minor correction.

. In view of abv analysis, buying the pound on dips for gain twd 1.7044 is favoured. On the downside, only a daily close below 1.6921 indicates a temporary top is made instead n shifts risk to downside for a retracement to 1.6887 (61.8% r of 1.6821-1.6996, adjust if necessary) but sup 1.6853 (Mon's low) sud hold.

GBP%20may%2007.png
 
Last edited by a moderator:
There could be a retracement on the GBPUSD to the 1.6900 level from where it may bounce to the upside.
 
AceTraderFx May 13: Daily Technical Outlook on GBP/USD

DAILY TECHNICAL OUTLOOK ON GBP/USD

Last Update At 13 May 2014 00:30GMT

Trend Daily Chart

Up

Daily Indicators
Turning down

21 HR EMA
1.6872

55 HR EMA

1.6885

Trend Hourly Chart
Sideways

Hourly Indicators
Neutral

13 HR RSI
50

14 HR DMI

0

Daily Analysis
Consolidation b4 one more fall

Resistance
1.6975 - Last Thur's high
1.6938 - Last Fri's high
1.6916 - Last Fri's Asian low (now res)

Support
1.6832 - Last Fri's low
1.6821 - May 03 low
1.6792 - Apr 29 low


. GBP/USD - 1.6873.. Although cable found support at 1.6840 in NZ on Mon n then ratcheted higher to 1.6903 in European morning due partly to cross-buying in sterling. Renewed dlr's broad-based firmness checked intra-day gain n cable later retreated to 1.6863 in NY session.

. Looking at the hourly n daily charts, cable's rebound fm 1.6840 to 1.6903
y'day suggests choppy trading abv last Fri's low at 1.6832 wud be seen but as sell off fm last Tue's near 5-year peak at 1.6996 indicates MT uptrend fm 2013 trough (Jul) at 1.4814 has possibly made a temporary top there, 1.6916 (prev. sup, now res) shud hold n downside bias remains for re-test of said sup. Below 1.6821 (May 3 low) anytime wud add credence to this view n further decline to 1.6791/92, being the 'minimum' 38.2% r of intermediate rise of 1.6460-1.6996 n Apr 29 low respectively, wud follow but prominent 'bullish convergences' on the hourly oscillators on such a move shud keep price abv 1.6762 (Apr 23 low).

. In view of abv analysis, trading cable is cautiously favoured n only abv
1.6938 (last Fri's high) wud dampen present mildly bearish scenario on cable n risk stronger retracement to 1.6970/75 b4 prospect of retreat.

GBP%20may%2013.png
 
Last edited by a moderator:
AceTraderFx May 20: Daily Technical Outlook on GBP/USD

DAILY TECHNICAL OUTLOOK ON GBP/USD
Last Update At 20 May 2014 00:13GMT

Trend Daily Chart
Up

Daily Indicators
Turning down

21 HR EMA
1.6819

55 HR EMA
1.6815

Trend Hourly Chart
Sideways

Hourly Indicators
Falling

13 HR RSI
46

14 HR DMI
-ve

Daily Analysis
Marginal rise b4 strg retreat

Resistance
1.6903 - Last Mon's high
1.6875 - Last Tue's high
1.6845 - Y'day's high

Support
1.6784 - Last Fri's low in Europe
1.6732 - Last Thur's low
1.6657 - Apr 15 low


. GBP/USD - 1.6815... Cable rebounded after retreating fm 1.6833 to 1.6806 in European morning on Mon n price later rose abv later Fri's high of 1.6841 to 1.6845 ahead of NY open, however, lack of follow through buying prompted profit-taking there n cable retreated to 1.6812 b4 moving sideways in NY afternoon.

. Looking at the hourly n daily charts, although y'day's break of last Fri's high to 1.6845 signals decline fm May's near 5-year peak at 1.6996 has formed a minor low there n another day of choppy trading wud continue, as the last week's breach of indicated sup at 1.6762 strongly suggests MT uptrend fm 1.4228 (2010 trough) has formed a temporary top at 1.6996, downside bias remains n 1.6895/03, being the 'dynamic' 61.8% r of 1.6996-1.6732 n last Mon's high respectively, wud hold n yield another decline later this week. Below 1.6784 (hourly sup) anytime wud suggest recovery is over, 1.6732 again. Looking ahead, below said sup wud indicate the pound is en route to 1.6560, this is a 'minimum' 38.2% r of the intermediate MT rise fm 1.5854 (Nov 2013 low) later this month.

. Today, selling cable on intra-day recovery is still favoured n only abv 1.6903 wud abort this bearish scenario n risk gain to 1.6938.
GBP%20may%2020.png
 
Last edited by a moderator:
AceTraderFx May 23: Daily Technical Outlook on GBP/USD

DAILY TECHNICAL OUTLOOK ON GBP/USD

Last Update At 22 May 2014 23:54GMT

Trend Daily Chart

Up

Daily Indicators
Turning down

21 HR EMA
1.6870

55 HR EMA
1.6865

Trend Hourly Chart
Sideways

Hourly Indicators
Neutral

13 HR RSI
47

14 HR DMI
+ve

Daily Analysis
Choppy trading to continue

Resistance
1.6997 - May 6 high
1.6938 - May 9 high
1.6923 - Wed's high

Support
1.6852 - Y'day's low
1.6802 - Tue's low
1.6784 - Last Fri's low in Europe


. GBP/USD - 1.6867... Cable went through a mini 'roller-coaster' session on
Thur as despite a brief rise to 1.6917 in European morning, release of U.K. Q1
GDP which was in line with forecast disappointed the market n the pound swiftly reterated to 1.6862 n then later to 1.6852 in NY afternoon b4 recovering.

. Looking at the daily picture, although early rally abv res at 1.6903 (last
week's high) to 1.6923 on Wed signals correction fm May's near 5-year peak at 1.6997 (Reuters) has ended at last Thur's 4-week trough at 1.6732, aforesaid retreat fm 1.6917 suggests further choppy trading below 1.6997 wud continue n a stronger pullback twd 1.6802 may be seen, however, reckon sup at 1.6784 wud hold n upside bias remains for another rise next week after consolidation but a daily close abv 1.6923 is needed to bring a re-test 1.6997 next week. Looking ahead, abv 1.6997 wud confirm MT uptrend fm 1.4228 (2010 trough) has once again resumed n yield gain twd the key daily res at 1.7044 (Aug 2009).

. In view of abv analysis, buying cable on dips for another rise twd 1.6823 is still favoured today. On the downside, only a firm break of 1.6782/84 wud abort present mildly bullish scenario n may risk subsequent weakness twd 1.6732.
GBP%20may%2023.png
 
Last edited by a moderator:
AceTraderFx May 29: Daily Technical Outlook on GBP/USD


DAILY TECHNICAL OUTLOOK ON GBP/USD
Last Update At 29 May 2014 00:30GMT

Trend Daily Chart

Sideways

Daily Indicators
Falling

21 HR EMA
Rising fm o/s

55 HR EMA

29

Trend Hourly Chart
Down

Hourly Indicators
Rising fm o/s

13 HR RSI
1.6736

14 HR DMI
1.67

Daily Analysis

Resumption of recent decline

Resistance
1.6816 - Y'day's high
1.6782 - Tue's low, now res
1.6732 - May 16 low, now res

Support
1.6697 - Y'day's 5-week low
1.6657 - Apr 15 low
1.6624 - 50% r of 1.6252-1.6997

. GBP/USD - 1.6717... Cable came under renewed selling in Asia at 1.6816 Wed n fell to 1.6761 at European open. Intra-day decline continued after data showed growth in U.K. retail slowed in May n price subsequently tumbled to a 6-week low of 1.6697 in NY morning b4 staging a minor rebound on short covering.

. Looking at the daily chart, y'day's breach of previous May's low at 1.6732 n daily close below there confirms a major top has been formed at May's near 5-year peak at 1.6997 (Reuters) n price is en route to 1.6560 in June, this is a 'minimum' 38.2% r of the intermediate MT rise fm 1.5854-1.6997. Having said that , as daily oscillators wud be o/sold territory on such a move, daily sup at 1.6460 (Mar 24 low in NZ) shud contain weakness. Therefore, trading cable fm short side is favoured, however, one shud look to take profit on next decline as the hourly oscillators wud display bullish convergences on next decline, suggesting sharp fall is unlikely to be seen n reckon 1.6624, this is the 'natural' 50% r of intermediate rise of 1.6252-1.6997, wud hold n yield rebound later.

. Today, expect weakness to 1.6555 n only abv 1.6782 wud indicate temporary low is made, risk stronger retracement twd 1.6813/16 b4 another fall next week.
GBP%20may%2029.png
 
Last edited by a moderator:
AceTraderFx Jun 6: Daily Technical Outlook & Trading Ideals on GBP/USD

DAILY TECHNICAL OUTLOOK ON GBP/USD

Last Update At 06 Jun 2014 00:52GMT

Trend Daily Chart
Sideways

Daily Indicators
Turning up

21 HR EMA
1.6789

55 HR EMA
1.6768

Trend Hourly Chart
Nr term up

Hourly Indicators
Easing fm o/bot

13 HR RSI
66

14 HR DMI
+ve

Daily Analysis
Consolidation with upside bias

Resistance
1.6883 - May 27 high
1.6845 - 38.2% r of 1.6997-1.6693
1.6825 - Y'day's high in NY

Support
1.6782 - Tue's high (now sup)
1.6758 - 50% r of 1.6693-1.6825
1.6723 - Y'day's low


. GBP/USD - 1.6809... Despite cable's brief jump to 1.6793 in European morning due partly to cross-buying in sterling, price fell after BoE kept its monetary policy unchanged. Cable then briefly dropped to 1.6723 but only to rally in tandem with euro to session high of 1.6825 in NY afternoon.

. Looking at the hourly n daily charts, y'day close abv Tue's high of 1.6782 signals cable's decline fm May's near 5-year peak at 1.6997 (Reuters) has indeed made a temporary low at last Thur's 5-week trough at 1.6693 n as long as sup at 1.6758 (50% r fm 1.6693) holds, gain to 1.6845 n then 1.6883 is likely, being the 'natural' 50% r of 1.6997-1.6693 n May's 27 high respectively, however, as hourly oscillators wud be in o/bot territory on such a move, upside wud falter below pivotal res at 1.6923 (May 21 high) n yield retreat next week.

. In view of abv analysis, buying cable on dips in anticipated of further gain to 1.6860/70 is favoured today but profit shud be taken on upmove. On the downside, only below 1.6723 wud suggest aforesaid correction fm 1.6693 is over n shift risk to the downside for re-test of 1.6693, however, this move is unlikely to be seen today.

GBP%20jun%206.png
 
Last edited by a moderator:
Back
Top