AceTraderFx April 4: Daily Technical Outlook on Major –GBP/USD

AceTraderFx Oct 27: Weekly Technical Outlook & Trading Ideals on GBP/USD

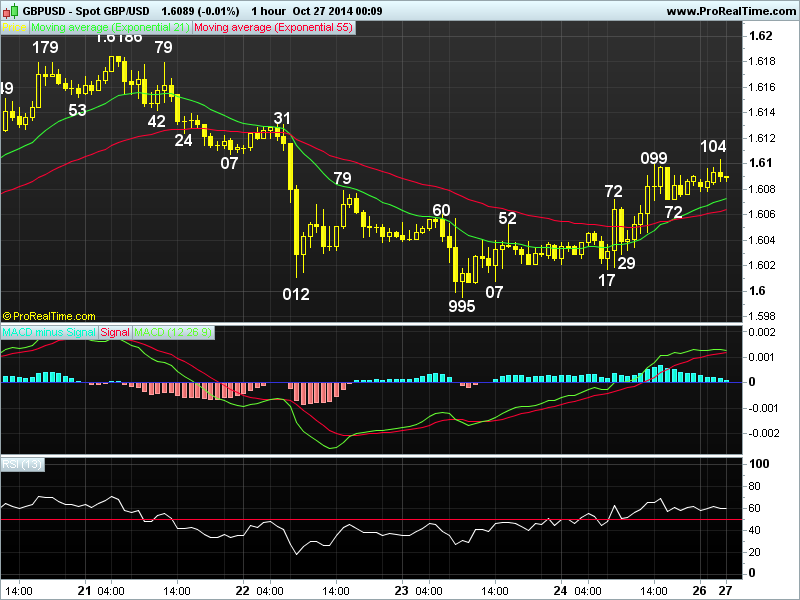
WEEKLY GBP/USD TECHNICAL OUTLOOK
Last Update At 27 Oct 2014 00:11GMT

Trend Daily Chart
Sideways

Daily Indicators
Bullish convergences

21 HR EMA
1.6073

55 HR EMA
1.6064

Trend Hourly Chart
Near term up

Hourly Indicators
Rising

13 HR RSI
59

14 HR DMI
+ve

Daily Analysis
Consolidation with upside bias

Resistance
1.6186 - Last Tue's high
1.6131 - Wed's high
1.6104 - Mon's high (Aust.)

Support
1.6017 - Last Fri's low
1.5995 - Y'day's low
1.5966 - 70.7% r of 1.5875-1.6186

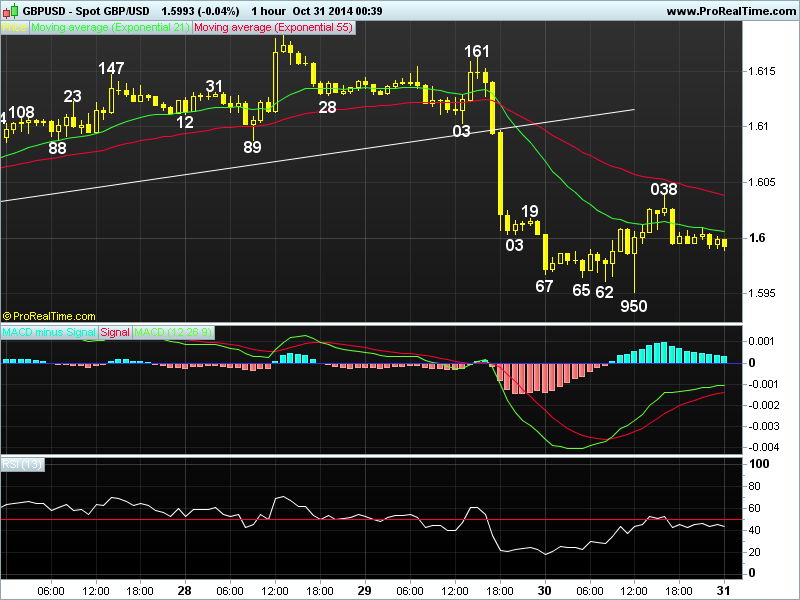
. GBP/USD - 1.6089 ... Although the pound extended previous week's up move fm Oct's 11-month trough at 1.5875 to 1.6186 last Tue, release of 'dovish' BoE minutes sent cable tanking to 1.6012, then 1.5995 Thur. Price managed to stage a short-covering rebound to 1.6099 due to usd's weakness in in NY morning on Fri.

. Let's look at the bigger picture 1st, cable's aforesaid rebound fm 1.5875 to 1.6186 signals MT downtrend fm Jul's near 6-year peak at 1.7192 has made a temporary low at 1.5875 n subsequent retreat fm 1.6186 suggests consolidation with downside bias is envisaged this week, a daily close below 1.5995 wud signal correction is over, then weakness twd 1.5875 wud be seen, however, as both the hourly & daily indicators wud display 'bullish convergences' on next decline, reckon projected sup at 1.5820, being 61.8% proj. of MT fall fm 1.7192-1.6052 measured fm 1.6525, wud contain weakness. On the upside, abv 1.6186 (reaction high fm 1.5875) wud confirm MT decline fm 1.7192 has indeed made a temporary low, the gain to 1.6379 wud be seen, this is 38.2% r fm 1.7192.

. Today, w/end's hawkish comments by BoE's McCafferty sent cable briefly to 1.6104, n gain to 1.6140 may be seen but 1.6186 shud hold n yield retreat.
gbp%20oct%2027.png
 
Last edited by a moderator:
AceTraderFx Oct 31: Daily Technical Outlook & Trading Ideals on GBP/USD

DAILY GBP/USD TECHNICAL OUTLOOK
Last Update At 31 Oct 2014 00:40GMT

Trend Daily Chart
Sideways

Daily Indicators
Bullish convergences

21 HR EMA
1.6006

55 HR EMA
1.6039

Trend Hourly Chart
Dow

Hourly Indicators
Bullish convergences

13 HR RSI
43

14 HR DMI
-ve

Daily Analysis
Consolidatin b4 one more fall

Resistance
1.6103 - Y'day's NY morning low
1.6089 - Tue's low
1.6038 - Y'day's high

Support
1.5950 - Y'day's low
1.5875 - Oct 15 low
1.5820 - 61.8% proj. of 1.7192-1.6052 fm 1.6525

. GBP/USD - 1.5993..Cable weakened to 1.5967 in Asia on Thur n then 1.5762 in Europe on Thur following Wed's FOMC selloff. Despite a minor bounce to .6009, price later briefly tumbled to session lows of 1.5950 after release of robust U.S. GDP but short-covering lifted price to 1.6038 b4 easing.

. Let's look at the bigger picture 1st, Wed's sharp sell off to 1.6003 n then 1.5950 Thur suggests the correction fm Oct's 11-month low at 1.5875 has ended earlier at 1.6186 last Tue n consolidation with downside bias remains for weakness to 1.5940/50 sup area (Oct 16 n y'day's low respectively), a daily close below there wud signal MT downtrend fm Jul's near 6-year peak at 1.7192 has once again resumed n yield re-test of Oct's 11-month low at 1.5875 next week. Looking ahead, below 1.5875 wud send cable lower to 1.5820, this is 50% proj. of the entire fall fm 1.7192-1.6052 measured fm 1.6525. Therefore, selling cable on recovery is the way to go n only abv 1.6088/89 (prev. sup, now res) wud dampen present bearish scenario on cable.

. Today, we're holding a short position in anticipation of marginal fall but 'bullish convergences' on hourly indicators wud keep cable abv 1.5900/10.
GBP%20oct%2031.png
 
Last edited by a moderator:
AceTraderFx Nov 5: Daily Technical Outlook & Trading Ideals on GBP/USD

DAILY GBP/USD TECHNICAL OUTLOOK
Last Update At 05 Nov 2014 03:06GMT

Trend Daily Chart
Sideways

Daily Indicators
Bullish convergences

21 HR EMA
1.5998

55 HR EMA
1.5999

Trend Hourly Chart
Sideways

Hourly Indicators
Neutral

13 HR RSI
54

14 HR DMI
+ve

Daily Analysis
Consolidation with downside bias

Resistance
1.6103 - Hourly sup (now res)
1.6055 - 50% r of 1.6183-1.5926
1.6038 - Last Thur's high

Support
1.5963 - Reaction low fm 1.6027 (Mon)
1.5926 - Mon's low
1.5875 - Oct 15 low

. GBP/USD - 1.6001...The British pound found renewed buying at 1.5965 at Asian open Tue n continued to trade with a firm undertone in Asia. Price gained to 1.6008 in early European morning b4 retreating to 1.5978. Later, cable rose to session high of 1.6016 at NY open b4 retreating on cross-selling vs euro.

. Looking at the daily picture, although price has staged a recovery after Mon's sharp retreat to 1.5926 n further choppy consolidation is envisaged for 1-2 days, as aforesaid move signals early correction fm 2014 trough at 1.5875 has indeed ended earlier at 1.6186 in Oct, reckon last Thur's high at 1.6038 wud cap upside n bring another fall twd said sup. Below ther wud signal the MT downtrend fm Jul's near 6-year peak at 1.7192 has possibly resumed n yield a re-test of 1.5875 later next week. On the upside, only abv 1.6055 (50% r of 1.6183-1.5926) wud indicate the pullback fm 1.6186 has ended instead n risk stronger gain twd 1.6103 (prev. sup, now res).

. Today, we are looking to sell cable on recovery to 1.6020 for weakness twd 1.5935 n only abv res 1.6038 wud prolong choppy trading n risk marginal gain but res at 1.6055 shud remain intact today n yield retreat.
gbp%20nov%2005.png
 
Last edited by a moderator:
AceTraderFx Nov 12: Daily Technical Outlook & Trading Ideals on GBP/USD

DAILY GBP/USD TECHNICAL OUTLOOK

Last Update At 12 Nov 2014 00:48GMT

Trend Daily Chart

Down

Daily Indicators
Bullish convergences

21 HR EMA
1.5890

55 HR EMA
1.5880

Trend Hourly Chart
Near term up

Hourly Indicators
Rising

13 HR RSI
64

14 HR DMI
+ve

Daily Analysis
Consolidation with initial upsdie bias

Resistance
1.6004 - Nov 8 high
1.5962 - 100% proj. of 1.5790-1.5918 fm 1.5835
1.5945 - Y'day's high

Support
1.5877 - Y'day's hourly res, now sup
1.5835 - Y'day's low
1.5790 - Last Fri's 1-year low

. GBP/USD - 1.5912... The British pound tracked intra-day movements in the euro closely again on Tue. Despite initial weakness to 1.5836 in subdued European trading, price ratcheted higher on short-covering n the pair later jumped to as high as 1.5945 in thin NY afternoon b4 easing ahead of Asian open today.

. Y'day's strg rebound fm 1.5835 to as high as 1.5945 suggests further volatile consolidation abv last Fri's 1-year low of 1.5790 wud continue with upside bias n abv 1.5945 wud bring further gain to 1.5987 (50% r of 1.6183-1.57 90), however, only a daily close abv previous strg res at 1.6023/27 wud confirm MT downtrend fm 2014 peak at 1.7192 (Jul) has made a temporary low, then stronger gain to 1.6071 wud be seen, this is a 'minimum' 38.2% r of the MT intermediate fall fm 1.6525, however, reckon 1.6158 (50% r) shud cap upside. On the downside, failure to penetrate 1.5945 n subsequent break of 1.5835 wud signal aforesaid MT downtrend has resumed n weakness to 1.5770 wud follow, however, 'bullish convergences' on hourly & daily indicators shud keep price abv 1.5710.

. Today, in view of abv analysis, buying cable on dips is favoured but pay attention to release of official U.K. data as well as BoE Inflation Report.
gbp%28234%29.png
 
Last edited by a moderator:
AceTraderFx Nov 17: Weekly Technical Outlook & Trading Ideals on GBP/USD

DAILY GBP/USD TECHNICAL OUTLOOK
Last Update At 17 Nov 2014 00:31GMT

Trend Daily Chart
Down

Daily Indicators
Bullish convergences

21 HR EMA
1.5774

55 HR EMA
1.5614

Trend Hourly Chart
Sideways

Hourly Indicators
Turning up

13 HR RSI
54

14 HR DMI
-ve

Daily Analysis
Consolidation with a neutral bias

Resistance
1.5790 - Nov 09 low (now res)
1.5760 - Last Thur's Aust. low
1.5695 - Last Fri's NY high

Support
1.5632 - 61.8% r of 1.5593-1.5695
1.5593 - Last Fri's fresh 14-month low
1.5536 - 100% proj. of 1.6525-1.5875 fm 1.6186

. GBP/USD - 1.5689... Despite trading initially abv its previous week's 1-year low of 1.5790 last week n recovering to 1.5945 Tue, the British pound tumbled on Wed after dovish BoE Inflation Report. Cable remained under pressure due to active cross-selling in sterling n weakened to 1.5593 Fri b4 recovering.

. Let's look at the bigger picture 1st, Fri's sello ff to a fresh 14-month trough of 1.5593 suggests MT downtrend fm May's near 6-year peak remains in progress n expect initial consolidation b4 extending further weakness to next projected downside target at 1.5536, this is equality measurement of intermediate fall fm 1.6525-1.5875 projected fm 1.6186. Having said that, as both hourly & daily technical indicators wud display 'bullish convergences' on such move, reckon 1.5456 (1.236 times extension of 1.6186-1.5790 fm 1.5945) wud contain weakness n bring correction later this week. On the upside, abv 1.5780/90 confirms a temporary low is made, then correction to 1.5835, 1.5877/82 wud follow.

. Today, although Fri's rebound fm 1.5593 signals a minor low is made n buying on dips is favoured, one can later sell the pound on further intra-day gain as 1.5750/60 wud cap upside n yield subsequent retreat.
GBP%20nov%2017.png
 
Last edited by a moderator:
Back
Top