AceTraderFx April 4: Daily Technical Outlook on Major –GBP/USD

AceTraderFx Sept 4: Daily Technical Outlook & Trading Ideals on EUR/USD

DAILY EUR/USD TECHNICAL OUTLOOK
Last Update At 04 Sep 2014 00:03GMT

Trend Daily Chart
Down

Daily Indicators
Falling

21 HR EMA
1.3142

55 HR EMA
1.3139

Trend Hourly Chart
Sideways

Hourly Indicators
Rising

13 HR RSI
58

14 HR DMI

+ve

Daily Analysis
Consolidation b4 one more fall

Resistance
1.3221 - Last Thur's high
1.3196 - Last Fri's high
1.3160 - Y'day's high

Support
1.3110 - Tue's near 1-year low
1.3105 - Sep 13' low
1.3066 - Jul 18 2013 low


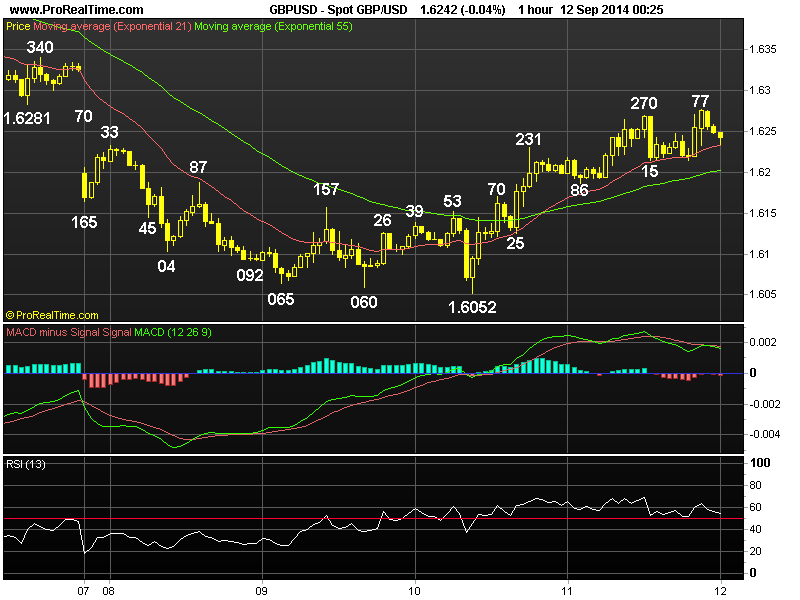
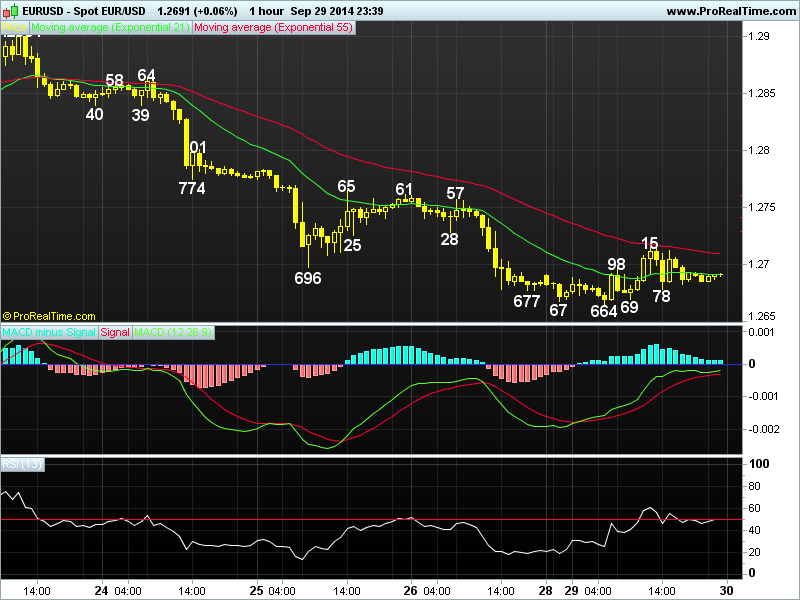
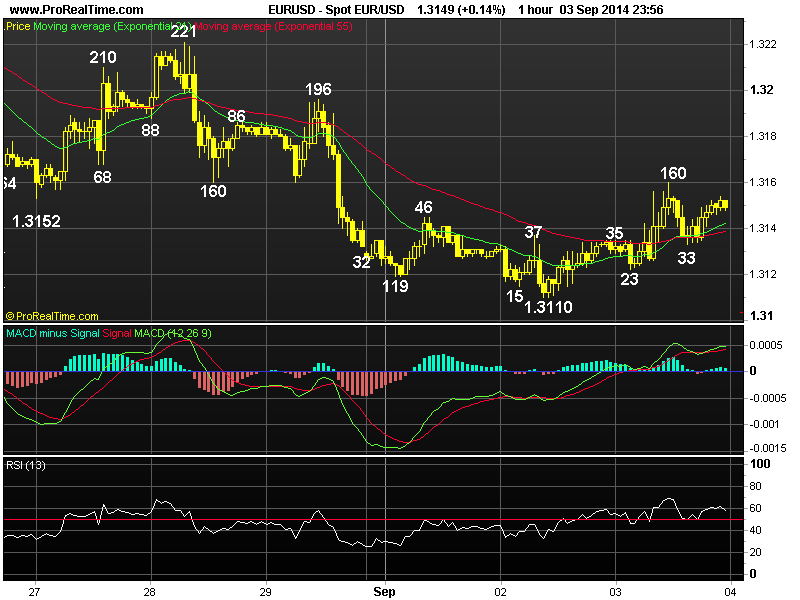
. EUR/USD - 1.3149 ... Despite Tue's weakness to a fresh near 1-year low at 1.3110, euro rebounded on Wed on short-covering ahead of Thur's ECB policy decision. Price jumped to 1.3156 on rumors of a ceasefire agreement between Ukraine n Russia. The single currency later rose to 1.3160 in NY b4 retreating.

. Looking at the hourly n daily charts, although euro's recovery fm Tue's low at 1.3110 suggests minor consolidation wud be seen, as long as res at 1.3196 (last Fri's high) holds, the MT downtrend fm May's 2-1/2 year peak at 1.3995 to retrace the entire MT rise fm 2012 bottom at 1.2042 shud resume later for a retest of previous daily sup at 1.3105 (Sep 13' low), then 1.3066, this is a minor daily chart sup as well as 100% projection of intermediate fall fm 1.3700-1.3333 fm 1.3433. Having said that, as the hourly oscillators' readings wud display very prominent bullish convergences on this move, reckon 'psychological' sup at 1.3000 wud hold n bring a long overdue minor correction.

. Today, selling on recovery in anticipation of one more fall is favoured, however, profit shud be taken on next decline. Abv said 1.3196 res wud risk correction to 1.3221, a daily close abv there wud yield stronger gain twd 1.3271.

EUR%20sep%2004.png
 
Last edited by a moderator:
AceTraderFx Sept 12: Daily Technical Outlook & Trading Ideals on GBP/USD

DAILY GBP/USD TECHNICAL OUTLOOK
Last Update At 12 Sep 2014 00:28GMT

Trend Daily Chart
Down

Daily Indicators
Rising fm o/s

21 HR EMA
1.6232

55 HR EMA
1.6203

Trend Hourly Chart

Near term up

Hourly Indicators
Turning down

13 HR RSI

54

14 HR DMI
+ve

Daily Analysis
Marginal rise b4 strg retreat

Resistance
1.6395 - Prev. hourly sup (now res)
1.6340 - Last Fri's high
1.6281 - Last Fri's low, now res

Support
1.6186 - Y'day's Asian low
1.6170 - Wed's NY morning high
1.6052 - Y'day's fresh near 10-month low


. GBP/USD - 1.6241 ... Despite cable's retreat fm Wed's 1.6231 tpp to 1.6186 in Asia on Thur, renewed buying interest contained weakness n price resumed upmove fm Wed's near 10-month low at 1.6052 fm in Europe. Cable later rose to 1.6270 in NY morning b4 retreating to 1.6215 n then climbed to 1.6277 in Aust.

. Cable's strg rebound fm 1.6052 to as high as 1.6270 confirms the recent MT downtrend fm Jul's near 6-year peak at 1.7192 has finally formed a temporary bottom there as this low was accompanied by prominent 'bullish convergences' on the hourly oscillators, therefore, a few days of choppy consolidation wud be seen n stronger retracement to 1.6279/81 ('minimum' 38.2% r of intermediate fall fm 1.6645-1.6052 n last Fri's sup, now res respectively) is envisaged, however, reckon res at 1.6340 (last Fri's high) wud cap upside n yield another fall. On the downside, only a breach of 1.6052 wud extend weakness twd 1.6000 next week.

. Today, as current price is still trading abv 21-hr n 55-hr emas, suggesting near term upside bias remains n buying on dips is favoured in anticipation of marginal rise, however, one can sell on next upmove. On the downside, below 1.6125 sup wud signal correction is over n yield weakness to 1.6080/90.

GBP%20sep%2012.png
 
Last edited by a moderator:
AceTraderFx Sept 17: Daily Technical Outlook & Trading Ideals on GBP/USD

DAILY GBP/USD TECHNICAL OUTLOOK
Last Update At 17 Sep 2014 00:31GMT

Trend Daily Chart
Down

Daily Indicators
Turning up

21 HR EMA
1.6247

55 HR EMA
1.6257

Trend Hourly Chart

Near term up

Hourly Indicators
Bearish divergences

13 HR RSI
55

14 HR DMI
+ve

Daily Analysis
Consolidation with upside bias

Resistance
1.6395 - Prev. hourly sup (now res)
1.6340 - Sep 05 high
1.6310 - Y'day's high

Support
1.6205 - Last Fri's low
1.6162 - Y'day's low
1.6125 - Hourly chart sup


. GBP/USD - 1.6256... The pound went through a rollar-coaster session on Tue due to market jitters ahead of Thur's Scottish referendum. Cable penetrated last Fri's 1.6205 low to 1.6162 in Europe but later jumped to as high as 1.6310 in NY due to dollar's broad-based weakness but briefly dipped to 1.6240.

. Looking at the hourly n daily charts, y'day's strg rebound to 1.6310 due to dlr's broad-based weakness together with active unwinding in cable suggests corrective rise fm last Wed's low at 1.6052 to retrace MT downtrend fm Jul's near 6-year peak at 1.7192 remains in progress n abv 1.6310 wud bring stronger gain to 1.6340 res (Sep 05 post-U.S. NFP high), however, high readings on hourly oscillators shud cap price below 1.6415/18 (38.2% r of 1.7001-1.6052 n 61.8% r of 1.6645-1.6052 respectively) n yield decline later. On the downside, below 1.6162 anytime wud confirm said correction fm 1.6052 is over instead n bring weakness to 1.6125 but 1.6052 shud hold until referendum results are known.

. Today, as current price is trading abv 21-hr n 55-hr emas, buying cable on dips in anticipation of further gain is cautiously favoured but profit shud be taken on subsequent rise.

GBP%20sep%2017%281%29.png
 
Last edited by a moderator:
AceTraderFx Sept 23: Daily Technical Outlook & Trading Ideals on GBP/USD

DAILY GBP/USD TECHNICAL OUTLOOK
Last Update At 22 Sep 2014 23:59GMT

Trend Daily Chart
Down

Daily Indicators
Turning up

21 HR EMA
1.6351

55 HR EMA
1.6347

Trend Hourly Chart
Sideways

Hourly Indicators
Rising

13 HR RSI
61

14 HR DMI
+ve

Daily Analysis
Initial rise b4 strg retreat

Resistance
1.6481 - Last Fri's European high
1.6433 - 61.8% r of 1.6525-1.6284
1.6403 - Hourly chart

Support
1.6322 - Y'day's low
1.6284 - Last Fri's NY low
1.6247 - Last Thur's low (AUS)


. GBP/USD - 1.6371 ... The British pound tracked euro's movement closely on Mon. Despite initial weakness to 1.6287 in NZ, cable rebounded after holding abv last Fri's 1.6584 low to 1.6666 in European morning. Despite a retreat to 0.6322, cable climbed to 1.6369 near NY close, then 1.6373 ahead of Asian open.

. Looking at the hourly & daily charts, y'day's rebound suggests the strg retreat fm last Fri's high at 1.6525 to 1.6284 has formed a temporary low there 1-2 days of choppy consolidation wud be seen with mild upside bias. Although further gain to 1.6403/05 (being hourly res n 50% r of 1.6525-1.6284 respectively) cannot be ruled out, reckon 'dynamic' res at 1.6433 (61.8% r) wud cap upside n yield another decline later. Looking ahead, although cable's strg rebound fm Sep's near 10-month trough at 1.6052 confirmed MT fall fm Jul's near 6-year peak at 1.7192 has made a temporary low, last Fri's sell off signals at least the leg of correction is over n weakness to 1.6233 (61.8% r) is expected, below, 1.6052.

. Today, cable's intra-day firmness due partly to cross-buying in sterling wud extend marginal gain, indicated res 1.6403/05 shud cap upside n yield subsequent decline. Selling on up move for weakness twd 1.6322 is therefore favoured.

GBP%20sep%2023%281%29.png
 
Last edited by a moderator:
AceTraderFx Sept 26: Daily Technical Outlook & Trading Ideals on GBP/USD

DAILY GBP/USD TECHNICAL OUTLOOK
Last Update At 26 Sep 2014 00:45GMT

Trend Daily Chart
Down

Daily Indicators
Turning up

21 HR EMA
1.6321

55 HR EMA
1.6336

Trend Hourly Chart
Sideways

Hourly Indicators
Turning up

13 HR RSI
54

14 HR DMI
-ve

Daily Analysis
Consolidation b4 one more fall

Resistance
1.6416 - Tue's high
1.6373 - Wed's European morning low
1.6353 - Tue's NY low

Support
1.6276 - Y'day's low
1.6247 - Last Thur's low (AUS)
1.6262 - Sep 16 low


. GBP/USD - 1.6330 ... The British pound swung wildly y'day. Price briefly penetrated last Fri's low at 1.6284 to 1.6276 in European morning, price staged a failed rally after mildly hawkish comments fm BOE's Carney but quickly reteated to 1.6294 in choppy NY session n later ratcheted higher near NY close.

. Although cable's rebound after y'day's resumption of decline fm last Fri;s 1.6525 to 1.6276, as this move signals at least the 1st leg of correction fm Sep's 9-1/2 month trough at 1.6052, downside bias remains for weakness twd 1.6233, this is the 'dynamic' 61.8% r of aforesaid rise. Below 1.6233 wud yield subsequent weakness twd 1.6175 (equality proj. of 1.6525-1.6284 measured fm 1.6416) but a daily close of 1.6162 sup is needed to signal correction fm 1.6052 is over. On the upside, only a daily close abv 1.6416 wud risk stronger gain to 1.6433 (61.8% r of 1.6525-1.6284) but reckon 1.6481 (last Fri's European high) wud cap upside.

. Today, we're holding a short position in anticipation of further weakness after initial consolidation in Asia but profit shud be taken on subsequent decline. Aabv 1.6373 may risk stronger gain to 1.6413/16 res area.
GBP%20sep%2026%281%29.png
 
Last edited by a moderator:
AceTraderFx Sept 30: Daily Technical Outlook & Trading Ideals on EUR/USD

DAILY EUR/USD TECHNICAL OUTLOOK
Last Update At 29 Sep 2014 23:39GMT

Trend Daily Chart
Down

Daily Indicators
Bullish convergences

21 HR EMA
1.2691

55 HR EMA
1.2709

Trend Hourly Chart
Down

Hourly Indicators
Bullish convergences

13 HR RSI

49

14 HR DMI
-ve

Daily Analysis
Consolidation b4 one more fall

Resistance
1.2801 - Hourly chart
1.2765 - Last Thur's NY high
1.2728 - Last Fri's European morning low

Support
1.2664 - Y'day's low
1.2641 - 61.8% proj. of 1.3433-1.2860 fm 1.2995
1.2600 - 2.236 times ext. of 1.3995-1.3503 fm 1.3700


. EUR/USD - 1.2691... Although Fri's close near the day's low pressured the single currency in Asia on Mon, price briefly weakened to a fresh 22-month trough of 1.2664 just ahead of European open, short-covering lifted the pair to 1.2715 in NY morning b4 coming off to 1.2678 b4 moving sideways in NY afternoon.

. Looking at the hourly & daily charts, although said Mon's low at 1.2664 was accompanied by 'bullish convergences' on the hourly indicators, as long as 1.2725/28 (prev. sup, now res) holds, the MT downtrend fm May's 2-1/2 year peak 1.3995 is en route to next chart obj. at at 1.2661 (Nov 13 2012 low), however, reckon 1.2600 (2.236 times extension of 1.3995-1.3503 measured fm 1.3700) wud hold on 1st testing ahead of Thur's ECB policy meeting n bring a much-needed minor correction. On the upside, a daily close abv 1.2765 wud be the 1st signal temporary low is made n yield stronger gain twd 1.2816, however, res at 1.2901 (last week's high on Tue) shud remain intact. In view of abv bearish analysis on euro, selling euro on recovery is the way to go.

. Today, we're holding a short position for one more fall but profit shud be taken on subsequent decline.
EUR%20sep%2030.png
 
Last edited by a moderator:
AceTraderFx Oct 8: Daily Technical Outlook & Trading Ideals on GBP/USD


DAILY GBP/USD TECHNICAL OUTLOOK
Last Update At 08 Oct 2014 01:02GMT

Trend Daily Chart
Down

Daily Indicators
Bullish convergences

21 HR EMA
1.6080

55 HR EMA
1.6068

Trend Hourly Chart
Sideways

Hourly Indicators
Neutral

13 HR RSI
50

14 HR DMI
+ve

Daily Analysis
Marginal rise b4 strg retreat

Resistance
1.6250 - Oct 2 high
1.6175 - Last Thur's NY high
1.6129 - Y'day's high

Support
1.6067 - Y'day's NY low
1.6027 - Y'day's Asian low
1.5997 - Prev. hourly res (now sup)


. GBP/USD - 1.6079... Although the British pound remained under pressure in Asia on Tue n fell to 1.6027, cable rose in tandem with euro to 1.6117 at European open n then 1.6129 in New York in part due to cross-buying of sterling together with dlr's broad-based weakness on the sell off in global stock markets.

. Looking at the hourly n daily charts, y'day's 'erratic' rise to 1.6129 suggests the MT downtrend fm Jul's near 2-year peak at 1.7192 has indeed formed a temporary low at 1.5943 on Mon n as long as 1.6027 sup (y'day's low) holds, upside bias remains for marginal gain, however, hourly indicators wud display 'bearish divergences' on next rise, reckon 1.6180 (being 50% r of intermediate fall fm 1.6416-1.5943) wud cap upside n yield another decline later this week.

On the downside, a daily close below 1.6027 wud be the 1st signal aforesaid correction fm 1.5943 is over n below 1.5997 wud yield resumption of MT downtrend to re-test said sup, below wud encourage for weakness twd 1.5820 (61.8% proj. of the entire MT fall fm 1.7192-1.6052 measured fm 1.6525) later this month.

. Today, in view of abv analysis, we're selling cable on next intra-day up move in anticipation of a strg retreat but 1.6000/10 wud hold fm here.
GBP%20oct%2008.png
 
Last edited by a moderator:
AceTraderFx Oct 13: Weekly Technical Outlook & Trading Ideals on GBP/USD

WEEKLY GBP/USD TECHNICAL OUTLOOK
Last Update At 13 Oct 2014 00:19GMT

Trend Daily Chart
Down

Daily Indicators
Bullish convergences

21 HR EMA
1.6078

55 HR EMA
1.6155

Trend Hourly Chart
Near term down

Hourly Indicators
Turn up

13 HR RSI
55

14 HR DMI
-ve

Daily Analysis
Consolidation with downside bias

Resistance
1.6151 - Last Thur's Asian low (now res)
1.6136 - Last Fri's high
1.6104 - last Thur's low

Support

1.6009 - Last Fri's low
1.5960 - Last Mon's European low
1.5943 - Last Mon's 11-month low

. GBP/USD - 1.6091 ... Although cable opened lower to an 11-month bottom of 1.5943 in NZ last Mon, price swiftly rallied on broad-based long liquidation in the greenback. The pound continued to ratchet higher to as high as 1.6227 on Thur b4 tumbling partly on cross-selling in sterling to 1.6009 in NY Fri.

. Let's look at the daily picture 1st, despite cable's aforesaid strg bounce fm 1.5943 to 1.6227, subsequent fall to 1.6009 signals correction is possibly over n a daily close below 1.6009 wud add credence to this view, then MT downtrend fm Jul's near 6-year peak wud pressure the pound twd 1.5820, this is 61.8% projection of abovementioned decline fm 1.7192-1.6052 measured fm 1.6525. Having said that, as the daily technical indicators wud display prominent 'bullish convergences' on such move, reckon 1.5718 (Aug 2013 high, now sup) wud contain weakness. On the upside, failure to penetrate 1.5943 low n subsequent rise abv 1.6227 wud confirm a temporary low has been made, then risk wud shift to the upsdie for stronger retracement to 1.642 ('minimum' 38.2% r of 1.7192-1.5943).

. Today, although Fri's rebound in NY afternoon signals decline fm 1.6227
has made a low at 1.6009, reckon 1.6136 wud cap upside n yield another decline.
GBP%20oct%2013.png
 
Last edited by a moderator:
AceTraderFx Oct 16: Daily Technical Outlook & Trading Ideals on GBP/USD

DAILY GBP/USD TECHNICAL OUTLOOK
Last Update At 16 Oct 2014 01:29GMT

Trend Daily Chart
Sideways

Daily Indicators
Bullish convergences

21 HR EMA
1.5965

55 HR EMA
1.5975

Trend Hourly Chart

Sideways

Hourly Indicators
Rising

13 HR RSI
59

14 HR DMI
+ve

Daily Analysis
Consolidation with upside bias

Resistance

1.6127 - Mon's high
1.6070 - Y'day's high
1.6021 - Hourly chart

Support
1.5940 - Prev. res, now sup
1.5875 - Y'day's fresh 11-month in NY
1.5820 - 61.8% proj. of 1.7192-1.6052 fm 1.6525

. GBP/USD - 1.5998 ... Cable swung wildly on Wed. Despite initial drop to 1.5877 in Asia, short-covering lifted cable n the pair later rallied to as high as 1.6070 due to dlr's broad-based weakness on downbeat U.S. retail sales. Price tumbled to fresh 11-month low at 1.5875 b4 rebounding to 1.6021 at NY close.

. Looking at the hourly n daily charts, y'day's strg rebound fm 1.5875 to 1.6021 suggests MT downtrend fm Jul's near 6-year peak at 1.7192 has possibly formed a temporary low there n few days of choppy consolidation with mild upside bias wud be seen, a breach of 1.6070 (y'day's high in NY morning) anytime wud confirm this view n stronger retracement to 1.6123/27, being min. 38.2% r of intermediate fall of 1.6525-1.5875 n Mon's high respectively, n then 1.6050/60 wud follow, however, hourly oscillators wud be in o/bot territory on such a move n price wud falter below 1.6200 (50% r fm 1.6525) n yield another fall next week.

. In view of abv analysis, buying cable on dips is recommended today n only a daily close below 1.5900 wud confirm aforementioned recovery is over n yield resumption of decline fm 1.7192 to re-test 1.5875, break wud extend to next downside obj. at 1.5820, this is 61.8% proj. of 1.7192-1.6052.
gbp%28232%29.png
 
Last edited by a moderator:
AceTraderFx Oct 21: Daily Technical Outlook & Trading Ideals on GBP/USD

DAILY GBP/USD TECHNICAL OUTLOOK
Last Update At 21 Oct 2014 00:35GMT

Trend Daily Chart

Sideways

Daily Indicators
Bullish convergences

21 HR EMA
1.6141

55 HR EMA
1.6106

Trend Hourly Chart
Near term up

Hourly Indicators
Rising

13 HR RSI
65

14 HR DMI
+ve

Daily Analysis
Consolidation with upside bias

Resistance
1.6227 - Oct 09 high
1.6200 - 50.0% r of 1.6525-1.5875
1.6179 - Y'day's high

Support
1.6127 - Hourly chart
1.6080 - Y'day's low
1.6030 - Last Fri's low

. GBP/USD - 1.6164 ... Despite y'day's brief retreat to session low at 1.6080 at European open, the British pound pared intra-day loss n rose to 1.6151 at NY open, helped by active cross-buying of sterling vs euro. Price continued to trade with a firm bias n climbed to a high of 1.6179 in NY afternoon.

. Looking at the hourly n daily charts, y'day's rally abv last Fri's high at 1.6126 suggests MT downtrend fm Jul's near 6-year peak at 1.7192 has formed a temporary low at last Wed's fresh 11-month trough at 1.5875 n consolidation with upside bias wud be seen for a stronger retrace. to 1.6200, being the 'natural' 50% r of intermediate fall fm 1.6525. Having said that, as hourly oscillators wud wud display bearish divergences on next rise, reckon res at 1.6227 (Oct 09 high) shud remain intact n bring a much-needed retreat later. On the downside, only below last Fri's low at 1.6030 wud indicate said recovery has ended instead n turn outlook bearish for weakness twds 1.5940.

. Today, in view of abv analysis, we're trading cable on both sides of the market n buy on intra-day retreat for marginal gain twd 1.6200 or sell if price
climbs to there 1st for a much-needed retracement. Below 1.6080, 1.6030/40.
GBP%20oct%2021.png
 
Last edited by a moderator:
Back
Top