USDCAD market insight by Solid ECN Securities
The instrument develops flat dynamics
The US dollar is again trading with upward dynamics against the Canadian currency during the Asian session, testing 1.27 for a breakout.
Considerable support for the US currency is provided by macroeconomic statistics from the US on consumer inflation published the day before.
Support and resistance
In the D1 chart, Bollinger Bands are reversing horizontally. The price range is changing slightly, but remains rather spacious for the current level of activity in the market. MACD is trying to reverse upwards keeping a previous sell signal (located below the signal line). Stochastic keeps a fairly strong downward direction and does not yet react to the resumption of growth of the US currency.
Resistance levels: 1.27, 1.275, 1.2786, 1.2812.
Support levels: 1.265, 1.26, 1.2558, 1.25.


Silver market update by Solid ECN Securities
Silver prices are consolidating near 23.5
The instrument still cannot recover to the local highs renewed on February 15. Then the reason for the wave of sales was the weakening of geopolitical tensions in Eastern Europe when it became clear that the forecasts and assumptions about possible military operations on the territory of Ukraine did not materialize.
Although investors have turned their attention to the usual macroeconomic background and started predicting the actions of world regulators, certain geopolitical risks remain, and therefore the demand for safe assets is not completely reduced. Also, despite the further growth of inflationary risks, the US Federal Reserve is in no hurry to adjust its monetary policy vector.
On Thursday, American investors focus on the Initial Jobless Claims release. It is expected that the value for the week of February 11 will decrease from 223K to 219K.
Support and resistance
On the daily chart, Bollinger bands grow moderately. The price range narrows slightly but remains quite spacious for the current level of activity in the market. MACD tries to reverse downwards and prepares to form a sell signal (the histogram should be below the signal line). Stochastic shows a more confident decline and signals further development of downward dynamics in the nearest time intervals.
Resistance levels: 23.6, 24, 24.37, 24.67.
Support levels: 23.32, 23, 22.7, 22.4.

 EURUSD market insight by Solid ECN Securities
The market consolidates to remain neutral
The EURUSD pair moves sideways around the level of 1.1346, correcting after the growth in the previous two trading sessions, which led to the renewal of local highs of February 11 due to positive macroeconomic statistics. Today, the European Central Bank (ECB) will publish its monthly report, which may positively impact the dynamics of the euro.
The USD Index is at the week's beginning, around 96. Investors are reacting to the minutes of the January meeting of the US Federal Reserve, published yesterday. The majority of the regulator's representatives are set for a faster increase in interest rates than previously thought.
Support and resistance
The asset is moving within a wide sideways range. Technical indicators are in a state of uncertainty: indicator Alligator's EMA fluctuations range narrowed almost completely, and the histogram of the AO oscillator forms downward bars, approaching the transition level.
Resistance levels: 1.148, 1.169.
Support levels: 1.1279, 1.1116.

USDCHF market update by Solid ECN Securities
The US dollar updates local lows
The US dollar showed a moderate decline against the Swiss franc during the morning trading session, again poised to test the strong support at 0.92. The day before, the instrument also made attempts to approach this level, but then the "bearish" momentum was not enough.
It is worth noting that investors practically ignored the strong macroeconomic statistics from the US that appeared yesterday. In particular, the volume of Retail Sales in the country showed a strong growth. The dynamics of Industrial Production were also positive. In January, production volumes increased.
Today, during the day, investors expect the publication of statistics on the dynamics of Imports and Exports for January from Switzerland. The US, in turn, will publish data on the Jobless Claims for the week ended February 11.
Support and resistance
On the D1 chart Bollinger Bands are sharply reversing downwards. The price range is narrowing actively, reflecting the emergence of ambiguous dynamics of trading in the short term. MACD is going down, keeping a fairly stable sell signal (located below the signal line). Stochastic keeps a confident downward direction but is already approaching its lows, which indicates the descending risks of oversold USD in the ultra-short term.
Resistance levels: 0.922, 0.925, 0.9276, 0.93.
Support levels: 0.92, 0.9177, 0.9157, 0.9125.


FTSE 100 Market update by Solid ECN Securities
Positive reporting pushes quotes up
The FTSE 100 index is trading near annual highs at around 7570 on the back of positive reports from commodity companies.
The world's largest supplier of commodities and rare earths, Glencore Plc, released a strong report, according to which EBITDA increased by 84% for the year to 21.3B dollars, while the company's net income was 5.0B dollars. In turn, net debt decreased by almost 2 times to 6.0B dollars. On the back of positive results, the issuer announced the launch of a new 550M dollar share buyback program.
Royal Gold Inc., another large precious metals and royalty trading company in the sector, reported quarterly revenue of 168.03M dollars, beating analysts' forecast of 165.4M dollars. Earnings per share were 1.04 dollars, with market estimates of 0.9 dollars.
Support and resistance
The index quotes are traded within the global ascending channel, still holding within it. Technical indicators are in a weakening buy signal state: the fluctuation range of the Alligator indicator EMAs is narrowing and the histogram of the AO oscillator is forming new descending bars, while approaching the transition level.
Support levels: 7510, 7330.
Resistance levels: 7620, 7800.

GBPUSD market update by Solid ECN Securities
GBPUSD prerequisites for a trend change
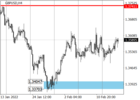
The GBPUSD pair continues the upward trading dynamics, trying to break the resistance level of 1.361 at the moment, which will allow quotes to continue rising to their January highs.
Yesterday's UK macroeconomic statistics supported the pound's position, as it supported the further tightening of monetary policy by the Bank of England at its regular meeting in March. Thus, the annual inflation rate was fixed at a new 30-year high of 5.5% (the indicator is growing for the fourth month in a row). The negative trend indicates a rising cost of living and will only worsen this year as electricity bills rise 54% and taxes rise in April.
The Bank of England expects inflation to peak at 7.25% by then, more than the 2% target.
However, the difficult situation in the economy, observed at the moment, supports the quotes of the national currency, as investors are looking forward to the moment when the British regulator moves to tighten monetary policy and raise interest rates decisively. Against this background, the GBPUSD pair may change the downtrend to an uptrend and renew the January highs around 1.3710.
Support and resistance
The long-term trend in the GBPUSD pair remains downwards. The key trend resistance is at 1.371. Now, buyers are testing the level of 1.361. If it is held, a decline to 1.351 is likely to follow.
The medium-term trend is upwards. At the end of January, market participants tested the key support 1.3404–1.337. The level was kept, which led to the growth of the GBPUSD rate. The first growth target is the January high of 1.3740 The second target is zone 2 (1.3883–1.3848).
Resistance levels: 1.361, 1.371, 1.382.
Support levels: 1.351, 1.3418, 1.3365.