Solid ECN | Daily Technical | Video | Major Products

eurusd-link.png


European currency shows moderate growth against the US dollar in the Asian session, recovering after the "bearish" start of the week and retreating from the local lows of April 14, updated the day before. The growth of the instrument is primarily driven by technical factors, while the news background changes slightly and still does not contribute to an increase in demand for risky assets.

Moreover, since the beginning of the week, no significant macroeconomic statistics have been received from Europe, while US Federal Reserve officials continue to stir up investor interest in the May meeting of the Fed. In particular, on Monday, the Chair of the St. Louis Fed, James Bullard, admitted the possibility of raising the interest rate immediately by 75 basis points in the near future, but noted that this is not a "baseline scenario". In addition to adjusting the rate, the regulator is also expected to launch a program of quantitative tightening.

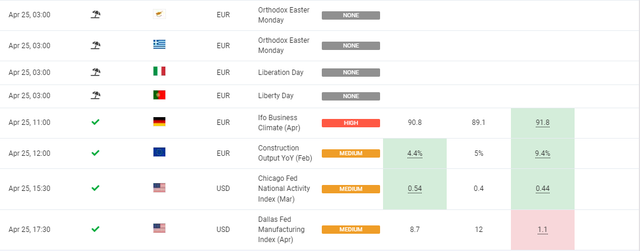
Today, investors will pay attention to the statistics on the dynamics of Industrial Production and Trade Balance in the euro area in February. It is assumed that the pace of production will increase by 0.7% after the zero dynamics of the previous month, and in annual terms, the figure may rise by 1.5% after falling by 1.3%. However, given the sharp deterioration in the geopolitical situation in Eastern Europe at the end of February, it is likely that the relevance of these data will be in question.

eurusd-1.png


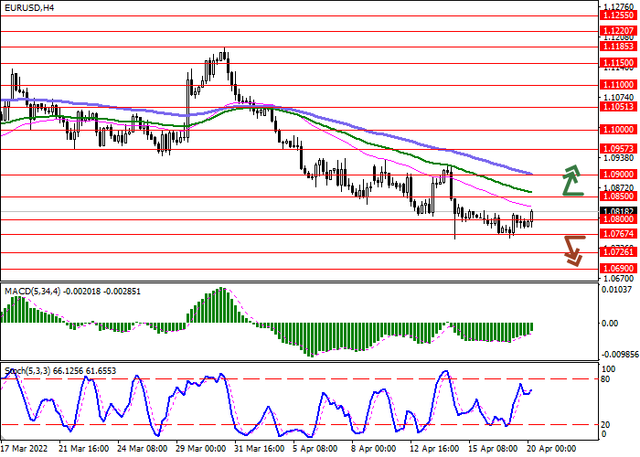
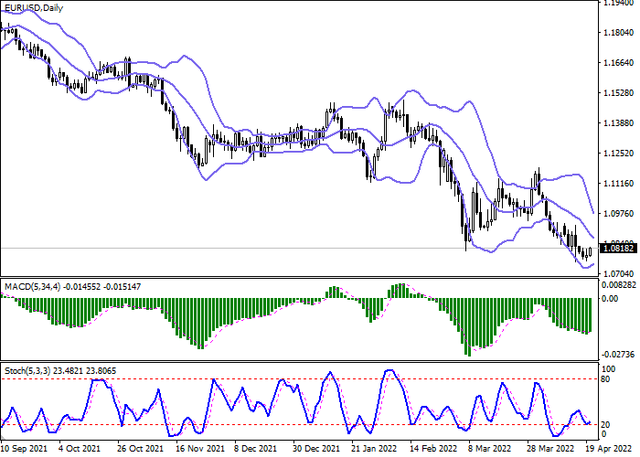
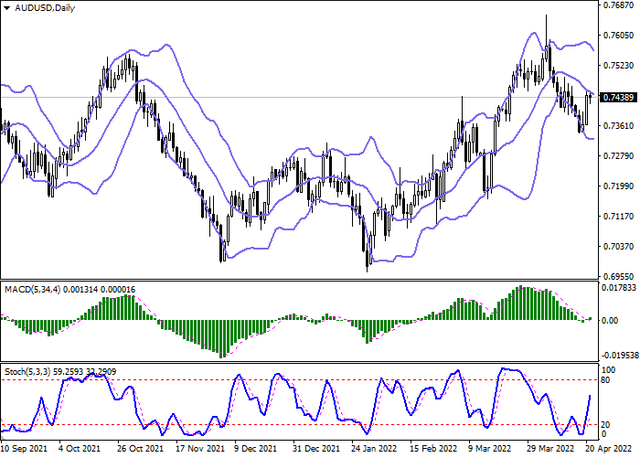
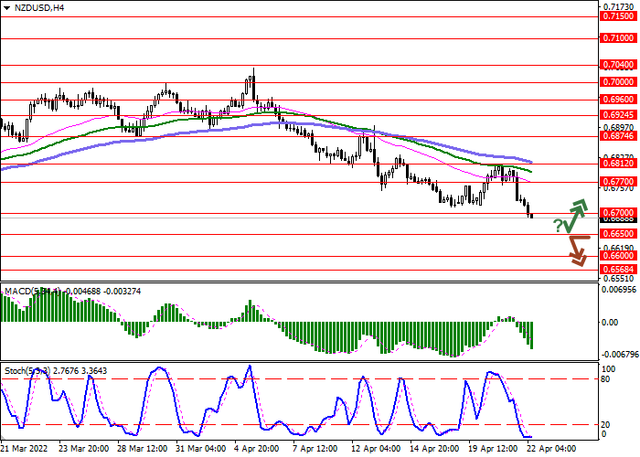
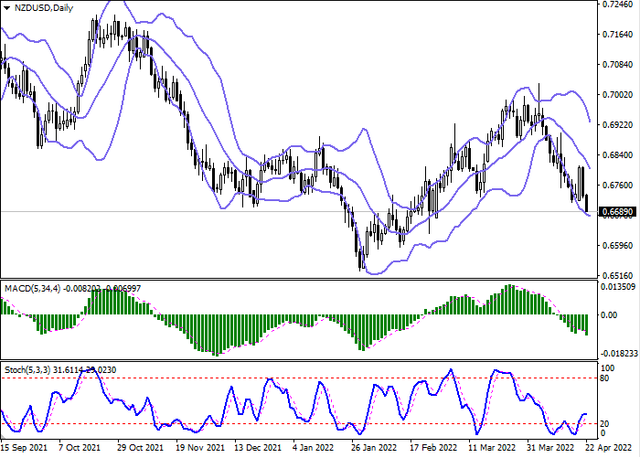
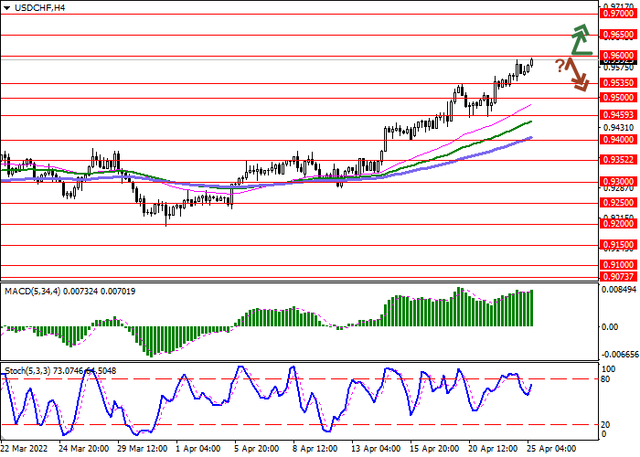
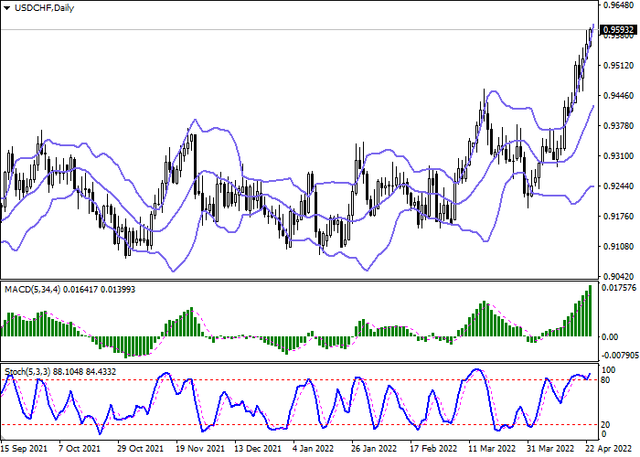
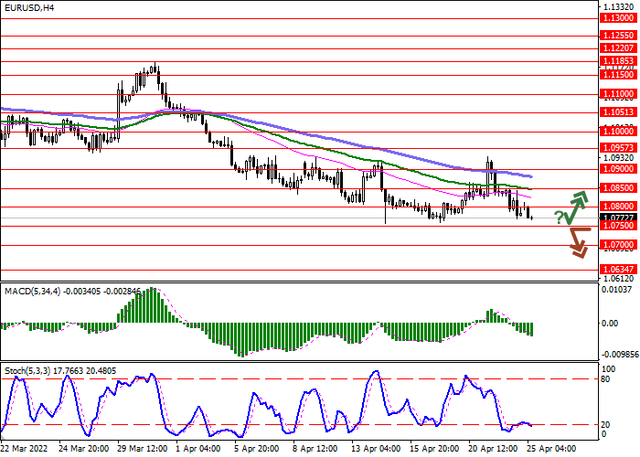
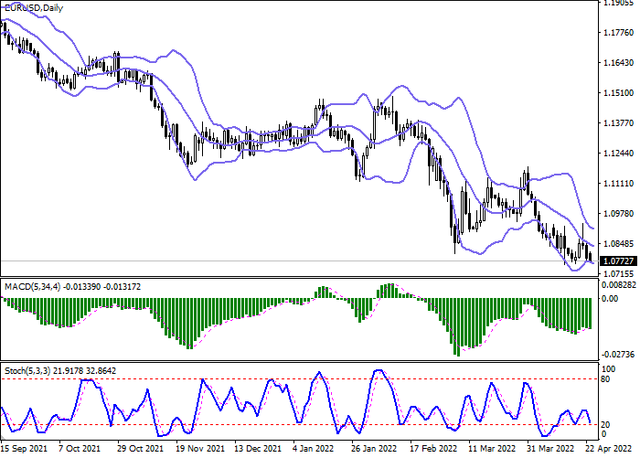
Bollinger Bands on the daily chart show a moderate decline. The price range is narrowing, reflecting the emergence of mixed trading dynamics in the ultra-short term. MACD indicator is reversing upwards forming a new buy signal (the histogram is trying to consolidate above the signal line). Stochastic is showing similar dynamics, again trying to rebound upwards from the level of "20".

Resistance levels: 1.085, 1.09, 1.0957, 1.1 | Support levels: 1.0800, 1.0767, 1.0726, 1.069

eurusd-2.png
 
1.png


The US dollar is recovering its position against the Japanese yen in Asian trading, correcting after a downtrend the day before, when the US currency showed a decrease in almost the entire spectrum of the market against the background of the rhetoric of the US Federal Reserve, which significantly corrected investors' expectations regarding a possible rate hike at the May meeting more than 0.50%.

San Francisco Fed President and FOMC member Mary Daly noted a correction in the federal funds rate to 2.5% by the end of the year, since a smooth transition to a neutral policy is the main priority of the regulator at the moment. The official stressed that the risks of uncertainty remain on the market caused by the development of the military conflict in Ukraine and the recorded outbreaks of COVID-19. In addition, traders drew attention to not the strongest statistics from the US on the dynamics of Existing Home Sales.

In turn, pressure on the yen was exerted by data from Japan. In March, Exports from the country slowed down from 19.1% to 14.7%, which turned out to be worse than analysts' forecasts at the level of 17.5%, while Imports for the same period decreased from 34.1% to 31.2%, while investors expected 28.9%. All this led to a trade deficit in March at -412.4 billion yen, which was significantly worse than the -100.8 billion yen forecast by analysts. Additional pressure on the position of the instrument was exerted by the Tertiary Industry Index of Japan, which fell by 1.3% in February after a decrease of 0.7% a month earlier.

A more "dovish" outcome of the Bank of Japan's meeting on April 28 and a further rise in US bond yields could see USD/JPY break out of its uptrend range and head back into correction.

usdjpy-1.png


Bollinger Bands on the daily chart show a steady increase. The price range expands, freeing a path to new record highs for the "bulls". MACD histogram preserves the uptrend and a buy signal (located above the signal line). Stochastic, having reacted to the emergence of corrective dynamics the day before, maintains a confident downward direction, signaling a strongly overbought US dollar in the ultra-short term.

Resistance levels: 128.62, 129.39, 130 | Support levels: 127.5, 127, 126.3, 125.6

usdjpy-2.png
 
audusd-1.png


The Australian dollar is showing mixed trading against the US dollar during the Asian session, holding near 0.7430. Since the opening of the daily session, the instrument has been trading mainly with the downtrend, but this still fits into the framework of a weak technical correction after active growth the day before. The Australian and New Zealand currencies rose significantly on Wednesday, reacting to the appearance of rather weak macroeconomic statistics from the US on the dynamics of Existing Home Sales.

As a result of March, Existing Home Sales fell again by 2.7% after a collapse of 8.6% a month earlier, which turned out to be much worse than analysts' forecasts. In addition, the quotes of AUD/USD were supported by statements by representatives of the US Federal Reserve, which weakened the hopes of investors for more active actions of the regulator aimed at tightening monetary policy in the country. The President of the Chicago Fed, Charles Evans, said that he adheres to a plan to raise the rate twice, by 0.50% each time. In turn, Fed spokesman Rafael Bostic, who is the President of the Fed of Atlanta, noted that raising the rate by more than 0.50% would be premature and could have negative consequences for the growth of the US economy.

In addition, the Reserve Bank of Australia (RBA) in the minutes of its April meeting indicated a "hawkish" position and gave a convincing hint to the market that the interest rate increase would occur earlier than expected, which contributed to the strengthening of AUD/USD in the middle of the week.

audusd-1.png


Bollinger Bands in D1 chart demonstrate a moderate decrease. The price range is narrowing, reflecting the emergence of ambiguous dynamics of trading in the short term. MACD is reversing to growth forming a weak buy signal (located above the signal line). The indicator is also trying to recover above the zero level. Stochastic is showing more active growth and is already approaching its highs, signaling the risks of the Australian dollar being overbought in the ultra-short term.

Resistance levels: 0.7456, 0.75, 0.755, 0.76 | Support levels: 0.74, 0.7366, 0.7341, 0.73

audusd-2.png
 
gbp-1.png


The British pound has been actively declining this week, reaching the support level of 1.3000 under the pressure of pessimistic investor sentiment regarding the growth of the national economy amid unprecedented high inflation.

According to a Deloitte survey, a record number of UK managers expect operating costs to rise sharply this year as inflation has proved more resilient than expected, with a majority (98%) of respondents believing that the Bank of England will not be able to bounce back prices in the nearest future. The survey included 89 CFOs, 22 of whom were from FTSE-100 companies and 34 from FTSE-250 companies. The results of the study show negative sentiment in business circles, primarily due to disruptions in supply chains and energy supply, as well as high prices as a result of the closure of warehouses with products during the coronavirus pandemic. Against this background, the projected decline in GDP in Q2 2022 is likely to force the Bank of England to decide to raise interest rates as early as this summer.

gbpusd-1.png


This news has a negative impact on GBPUSD, which is trading in a long-term downtrend. The key support at the moment is at 1.3000, in case of a breakdown of which the quotes will continue to fall with the targets of 1.2870-1.2700. The nearest resistance level is at 1.3150, near which one can consider new sales.

The mid-term trend is downward. This week, market participants are trying to break through the target zone 2 (1.3060–1.3026). If they succeed, the decline will continue with the target in the area of the target zone 3 (1.2716–1.2682). The key resistance of the trend is shifting to the levels of 1.3351–1.3317.

Resistance levels: 1.3150, 1.3288, 1.34 | Support levels: 1.3, 1.287, 1.27

gbpusd-2.png
 
nzd-1.png


The New Zealand dollar shows an active decrease against the US dollar during the Asian session, developing a strong "bearish" momentum that formed the day before. NZDUSD is testing 0.67 for a breakdown and updating local lows from February 28. The pressure on the instrument is again exerted by the growing US dollar, which is supported by the expectations of an early tightening of the monetary policy of the US Fed. The regulator expects to raise the interest rate immediately by 50 basis points already during its May meeting. In addition, the Fed is likely to launch a quantitative tightening program that will help reduce its balance sheet.

Additional pressure on the NZ dollar is exerted by the macroeconomic statistics from New Zealand released yesterday. The Consumer Price Index in Q1 2022 accelerated from 1.4% to 1.8%, which turned out to be only 0.2% worse than market expectations. In annual terms, inflation reached a new record high of 6.9%, although analysts had projected an increase to 7.1%.

nzdusd-1.png


Bollinger Bands on the daily chart show a steady decline. The price range is narrowing, reflecting the emergence of multidirectional trading dynamics in the short term. MACD reversed downwards having formed a new sell signal (located below the signal line). Stochastic, which made an attempt to grow a few days ago, is again reversing into a horizontal plane, reacting to a surge of "bearish" activity. It is necessary to wait for the trade signals from technical indicators to become clear.

Resistance levels: 0.677, 0.6812, 0.6874, 0.6924 | Support levels: 0.67, 0.665, 0.66, 0.6568

nzdusd-2.png
 
aud-forum-2.png


The Australian dollar shows a steady decline during the morning session, updating local lows from February 28. The instrument has been developing a downtrend since last Thursday, when the Fed Chairman Jerome Powell once again announced the need to raise interest rates by 0.50% at once at the May meeting. In addition, the regulator may launch a quantitative tightening program, which its representatives have also often spoken about recently. Investors took the official's speech as an additional signal to reduce risky positions, which provoked a noticeable strengthening of the US currency.

The macroeconomic statistics released on Friday from Australia failed to slow down the development of the "bearish" dynamics for the instrument, despite the fact that the data turned out to be quite positive in general. The Commonwealth Bank Manufacturing PMI in April rose from 57.7 to 57.9 points, while analysts had expected growth to only 57.8 points. The Services PMI for the same period strengthened from 55.6 to 56.6 points, but the market expected a much more noticeable increase to 58.5 points. At the same time, the Composite PMI rose from 55.1 to 56.2 in April.

aud-forum-1.png


In addition, China recorded the highest daily death rate of the population from COVID-19 this year, and the record for the incidence in Shanghai was 21K people. The city authorities announced a new round of quarantine measures last week, including daily testing of citizens for coronavirus. China remains one of the few countries that have adopted a "zero tolerance" policy, imposing mandatory quarantine for those who come into contact with infected citizens in order to contain the spread of the disease.

audusd-chart-1.png


Bollinger Bands in D1 chart demonstrate a stable decrease. The price range is expanding, but at the moment it is not keeping up with the surge of "bearish" sentiment. MACD is going down preserving a stable sell signal (located below the signal line). Stochastic retains a steady downtrend but is located in close proximity to its lows, which indicates the risks of oversold AUD in the ultra-short term.

Resistance levels: 0.72, 0.725, 0.73, 0.7341 | Support levels: 0.715, 0.71, 0.705, 0.7

audusd-chart-2.png
 
1.png


During the Asian session, the USDCHF pair is actively growing, testing the level of 0.9580 for a breakout and holding near the record highs of June 2020, renewed at the end of last week after the speech of the head of the US Federal Reserve, Jerome Powell.

The regulator chairman confirmed his intention to start an aggressive adjustment of the monetary policy parameters and raise the interest rate by 50 basis points at the next meeting in May to combat the inflation rate, which has been a record for 40 years. Also, the agency is likely to launch a quantitative easing program, which will allow it to reduce its balance sheet, which currently stands at about 9T dollars, mainly consisting of Treasuries and mortgage-backed securities.

5.png


Against the backdrop of rising buying sentiment, the US currency ignored the national macroeconomic data on Friday. The PMI Markit index in the manufacturing sector in April rose from 58.8 to 59.7 points, while analysts expected a slight decline to 58.2 points. In turn, the business activity index in the service sector for the same period fell from 58 to 54.7 points with neutral market forecasts. The composite business activity index corrected from 57.7 to 55.1 points, which was noticeably worse than analysts' expectations of 58.1 points.

3.png


On the daily chart, Bollinger Bands are steadily growing: the price range is expanding, letting the "bulls" renew the highs. The MACD indicator grows, keeping a strong buy signal (the histogram is above the signal line). Stochastic also maintains an upward direction but is near its highs, signaling that the dollar may become overbought in the ultra-short term.

Resistance levels: 0.96, 0.965, 0.97, 0.975 | Support levels: 0.9535, 0.95, 0.9459, 0.94

4.png
 
eur-1.png


The European currency shows a moderate decline against the US dollar during the Asian session, building on the "bearish" momentum formed at the end of last week, when the euro retreated from its local highs from April 7. The pressure on the instrument is exerted by the previous factors of a gradually strengthening dollar against the backdrop of deterioration in global economic prospects.

The military conflict in Ukraine is intensifying, despite the unprecedented sanctions imposed on the Russian economy by Western countries. Meanwhile, the EU is preparing another, sixth in a row, package of sanctions, which will likely be announced on April 25-29 and will significantly reduce the possibility of energy supplies from Russia. The issue of oil and gas imports for European countries is still extremely painful. Nevertheless, quite clear trends have been identified, and, not without pressure from the White House administration, the EU is gradually reducing its energy dependence on Russian resources, which, in turn, leads to an upward correction in energy prices, simultaneously pushing up the already high inflation in the region.

eur-calendar.png


The macroeconomic statistics from Europe published last Friday did not have a noticeable impact on the dynamics of the instrument, despite the fact that the data, in general, was not disappointing. The eurozone Composite Manufacturing PMI rose from 54.9 to 55.8 in April, beating its forecast of a decline to 53.9. The Services PMI for the same period strengthened from 55.6 to 57.7 points, contrary to forecasts of a decline to 55 points.

eurusd-1.png


Bollinger Bands in D1 chart demonstrate a stable decrease. The price range is expanding reluctantly, making way to new local lows for the "bears". MACD reversed downwards having formed a new sell signal (located below the signal line). Stochastic, having made an attempt to grow last week reversed downwards again and is testing the border of the oversold area.

Resistance levels: 1.08, 1.085, 1.09, 1.0957 | Support levels: 1.075, 1.07, 1.0634, 1.06

eurusd-2.png
 
usdcad-forum-1.png


The American currency is moderately declining, retreating from the local highs of March 16, updated the day before. Investors attribute the development of "bearish" trend to the emergence of technical factors, while the fundamental background changes slightly and still contributes to the strengthening of the US dollar.

In particular, traders are concerned about the prospects for the recovery of the global economy against the backdrop of further escalation of the conflict in Ukraine, which is the cause of the crisis in the commodity areas. In addition, there are reports from Beijing of a rapid increase in the incidence of coronavirus infection among the local population. Recently a large-scale lockdown ended in Shanghai, and now a similar prospect seems to threaten the capital of China. Over the past day, about 22K cases of COVID-19 were detected in the country, and more than 21K infected occurred in Shanghai. Further tightening of coronavirus restrictions could lead to a decline in energy consumption in the Chinese economy.

usdcad-war.png


Canadian macroeconomic statistics released late last week put moderate pressure on the positions of the Canadian currency, reflecting the expected slowdown in economic activity in the country. First of all, investors drew attention to a sharp slowdown in Retail Sales in February from 3.3% to 0.1%, while analysts had expected a decline of 0.1%. At the same time, Retail Sales excluding Automobiles over the same period slowed down only from 2.9% to 2.1%, while forecasts assumed zero dynamics.

usdcad-chart-1.png


Bollinger Bands in D1 chart show moderate growth. The price range expands, freeing a path to new local highs for the "bulls". MACD is growing, maintaining a relatively strong buy signal, being located above the signal line. Stochastic, having approached the level of "100", reversed into the horizontal plane, indicating risks of strongly overbought USD in the ultra-short term.

Resistance levels: 1.2750, 1.28, 1.2850, 1.29 | Support levels: 1.27, 1.265, 1.2600, 1.2538

usdcad-chart-2.png
 
usdjpy-forum.png


Quotes of USDJPY fell to a weekly low the day before, but today the yen is trying to regain its positions, despite the fact that the observed correction is largely associated with a slowdown in the growth of the US currency. Now the instrument is trading around 127.7.

Macroeconomic statistics from Japan turned out to be positive and supported the quotes of the national currency. The Unemployment Rate in the country in March fell to 2.6% from 2.7% a month earlier, despite the fact that analysts did not expect changes in the indicator. In turn, the Jobs / Applicants Ratio rose to 1.22 from the February value of 1.21, which coincided with analysts' forecasts. Also noteworthy is the Core CPI from the Bank of Japan, which stood at 1.1% in March, slightly up from 1.0% in the previous month. Investors are waiting for the results of the meeting of the Japanese monetary policy regulator, which will be held tomorrow. Prime Minister Fumio Kishida has already called for keeping the current monetary policy parameters and not raising interest rates to prevent a rapid fall in the yen.

In turn, the US dollar is holding at its highs, having exceeded the level of 102.000 in the USD Index the day before against the backdrop of disappointing data on the Conference Board Consumer Confidence Index for April, which fell to 107.3 points, despite preliminary estimates of 108.0 points. In addition, New Home Sales also corrected downward in March from 835K to 763K.

usdjpy.png


The instrument is trading in a global uptrend, correcting within the local Flag pattern. Technical indicators hold a steady buy signal, which is working out a slight correction: the range of EMA fluctuations on the Alligator indicator is expanding, and the histogram of the AO oscillator is high in the purchase zone.

Support levels: 126.94, 123.77 | Resistance levels: 128.96, 133​
 
Back
Top