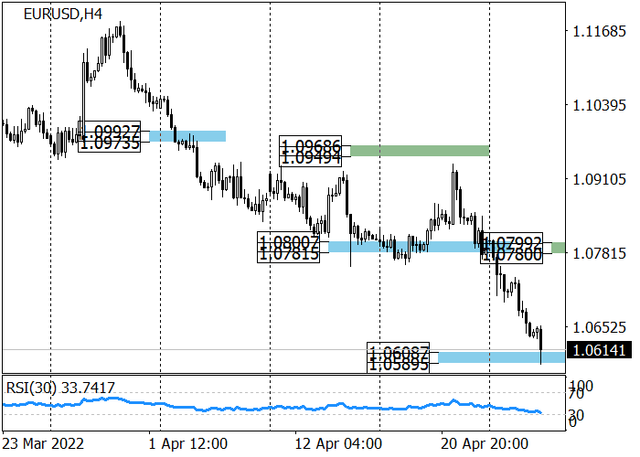
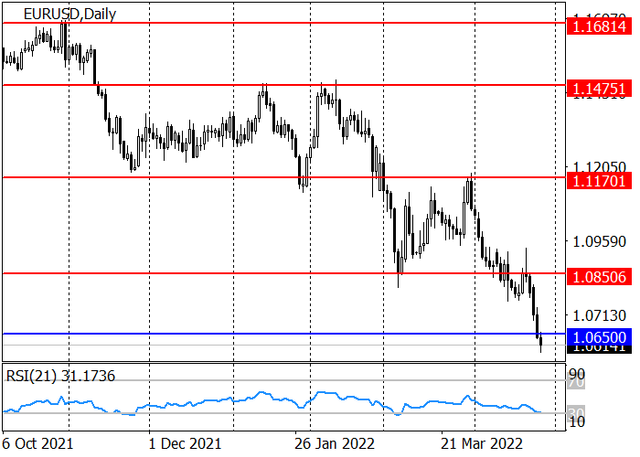
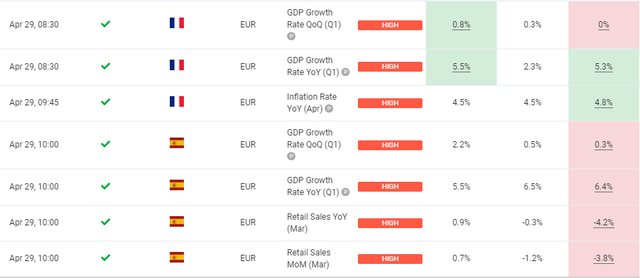
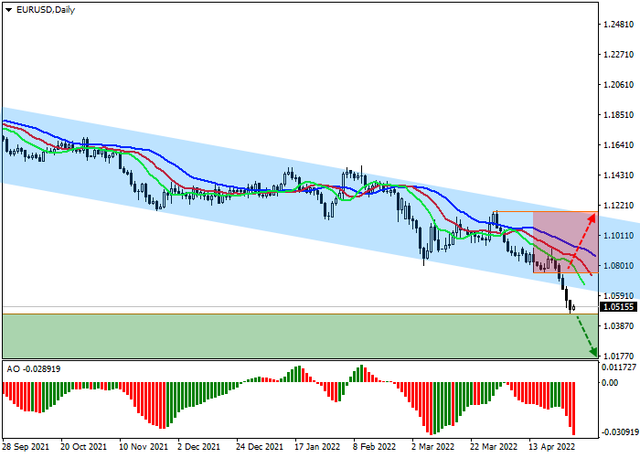
Solid ECN | Daily Technical | Video | Major Products

eurusd-forum.png


Today, the EURUSD pair renewed the 2020 low at 1.065, falling under the pressure of escalating the military conflict in Ukraine.

The decision of Russian President Vladimir Putin to sell natural gas to "unfriendly" countries for rubles is forcing European officials to refuse supplies and look for an alternative, more expensive options, which leads to inflation rising to a record high of 7.4% YoY. Analysts suggest that the negative trend will continue, and in April, the figure will reach 7.5%. Also, German Economic Minister Robert Habeck said on Tuesday that the country can now stop importing Russian oil, and Poland is ready to help it search for new suppliers, which has already indicated its position on refusing to renew existing contracts. Authorities hope to find alternatives in the coming days, the official said.

Against the backdrop of high inflation, the European Central Bank (ECB) is forced to adjust the current parameters of monetary policy. There are no official statements about the upcoming interest rate hike, however, according to analysts at Goldman Sachs Group, the regulator may adjust the rate by 25 basis points in July, and by 2023 the value will reach 1.25%. If ECB officials confirm this information, we can expect the EUR/USD pair to strengthen, and until then, the instrument is waiting for trading in a downtrend.

The US dollar is rising ahead of the US Federal Reserve's interest rate decision on May 4th. It is expected that it will rise by 0.5% to 1%, which will help fight against high inflation.

The long-term trend is downward. Today, the asset has reached the support level of 1.0650, and after its breakdown, it may drop to 1.05, 1.035.

eurusd-1.png


As part of the medium-term downtrend, the price reached the target zone 3 (1.0608 - 1.0589), after the breakdown of which the fall will continue with the target around zone 4 (1.0416 - 1.0397). Otherwise, we can expect a correction to the area of the key trend resistance 1.0799 - 1.078.

Resistance levels: 1.0850, 1.117 | Support levels: 1.065, 1.05

eurusd-2.png
 
gbpusd-forum-1.png


The British pound continues its rapid decline, which began last Friday, and is currently trading in the area of 1.2523.

In addition to the economic reasons for the rapid downward movement in the asset, among which the main ones are a record increase in the cost of utilities and a drop in consumer demand (data from the Confederation of British Industry (CBI) recorded a decrease in retail sales in April to -35 points from 9 points a month earlier), there are also political aspects. Experts argue that there is a fairly high probability of Boris Johnson's early departure from the post of Prime Minister of Great Britain, whose resignation is advocated by the Conservative Party. In 2020, Johnson's cabinet repeatedly violated a strict ban on public gatherings during the lockdown, according to an internal investigation. If the official's guilt is proven, he will have no choice but to resign, which, in turn, will put even more pressure on the pound.

Meanwhile, it is estimated that the British economy will suffer losses of 6.2B pounds due to anti-Russian sanctions imposed after the outbreak of the military conflict in Ukraine. Companies supplying luxury goods to Russia (Bentley and Aston Martin, Burberry) will record the greatest losses: in the next ten years they may lose 881.7M pounds of income, while the IT sector may lose about 4.1M pounds, and technology companies can lose 6.7M pounds.

This week, the US currency is actively adding in value, consolidating above 103.000 in the USD Index. Meanwhile, the situation in the national economy continues to deteriorate. The rate on 30-year mortgages increased again, amounting to 5.37%, surpassing the value of 5.20% in the previous period. Naturally, the negative dynamics provoked a drop in demand for mortgage loans, and the lending index fell by 8.3% compared to a 5.0% decline a week earlier.

gbpusd-chart.png


The instrument continues to trade below the support line of the global downward channel, moving into the acceleration stage. Technical indicators are holding a sell signal, which is strengthening: the range of EMA fluctuations on the Alligator indicator expands in the direction of decline, and the histogram of the AO oscillator is held deep in the sales zone.

Support levels: 1.2477, 1.21 | Resistance levels: 1.2742, 1.326​
 
eurusd-forum-1.png


Quotes of EUR/USD are trading at the lowest levels since 2017 around 1.0520. The downtrend in the asset is intensifying against the backdrop of the negative impact of the possible consequences of the previously adopted anti-Russian sanctions, and, in particular, the ban on the import of raw materials and fertilizers. After the refusal of countries "unfriendly" to Russia to adhere to the new scheme of paying for energy resources in rubles, the PJSC Gazprom announced the termination of gas supplies to Poland and Bulgaria. Meanwhile, the German authorities showed solidarity on the issue of a complete ban on the purchase of Russian fuel, noting the need for a gradual transition to the use of alternative sources. Thus, the country withdrew its objections to a complete embargo on the supply of "black gold" from the Russian Federation and joined the rest of the EU members in this matter.

eur-calendar-1.png


In the meantime, inflationary pressures in Germany and in the euro area as a whole continue to grow, which is reflected in macroeconomic indicators. German Consumer Price Index in April year on year reached 7.4% for the first time since 1974, rising from 7.3% a month earlier and yielding to analysts' forecast at 7.2%, while Italian Consumer Confidence Index corrected to 100.0 points from 100.8 points. The Consumer Price Index in Spain showed a downtrend and reached 8.4% after 9.8% shown in the previous period; however, despite the decline in inflation, Unemployment Rate in the country is fixed at a high level: 13.65% against 13.33%, shown in March.

eur-calendar-2.png


In turn, the US currency could not ignore the negative fundamental background and came under pressure from weak data on the labor market, after which it began a downward correction, dropping from 103.700 to 103.400 in the USD Index. Thus, according to statistics, the Continuing Jobless Claims amounted to 1.408 million, exceeding the projected 1.403 million. Another increase in the Core Personal Consumption Expenditures index should also be noted: the value in Q1 increased to 5.20% from 5.00%.

eurusd-chart.png


The instrument is trading below the support line of the wide descending channel, which the price crossed the day before. Technical indicators maintain the global sell signal: the fast EMAs of the Alligator indicator are below the signal line, and the histogram of the AO oscillator continues to decline in the sell zone, forming descending bars.

Support levels: 1.0470, 1.0170 | Resistance levels: 1.0760, 1.1170​
 
audusd-forum-1.png


The Australian currency is declining against the US dollar amid historically strong Consumer Price Data in Q1 2022. Now AUDUSD is trading in a downtrend, at around 0.7155.

The country's inflation rate reached 5.1% for the first time in more than 20 years, adding 2.1% for the current quarter and demonstrating the highest growth rate on record, while the Export Price Index rose from 3.5% to 18.0%. Investors are looking forward to the Reserve Bank of Australia meeting scheduled for May 3, during which, as predicted, the interest rate could be increased by 15 basis points to 0.25%, in which case the pre-election position of Prime Minister Scott Morrison could seriously deteriorate. Even now, in addition to ordinary citizens, Australian officials are also expressing their dissatisfaction with his policies. The day before, the candidate for Finance Minister from the Labor Party, Jim Chalmers, accused the Prime Minister of rising prices and falling living standards. He noted that the current price increase is only the beginning, and major financial shocks await citizens ahead.

audusd.png


On the daily chart, the price is within the Expanding Formation pattern, approaching the support line. Technical indicators continue holding a steady sell signal: the range of the Alligator indicator EMAs fluctuations is expanding in the direction of decline, and the histogram of the AO oscillator forms descending bars.

Support levels: 0.7087, 0.6965 | Resistance levels: 0.7280, 0.757​
 
usdchf-forum-1.png


USDCHF, D1
On the daily chart, the price continues its active growth, which began in April. Last week, the trading instrument reached its highest values since May 2020 at the level of 0.9758, if it is broken out, the uptrend may continue; however, at present, the development of a downward correction of quotations to the area of 0.9572 (retracement of 23.6%), 0.9533 (extension of 100.0%, Ascending Fan line of 38.2%) is not excluded. In general, the potential for strengthening USD/CHF is quite high, which is signaled by the upward reversal of Bollinger Bands and the increase in the MACD histogram in the positive zone, but Stochastic is reversing downwards in the overbought zone and may leave it, having formed a sell signal.

usdchf-chart-1.png


USDCHF, W1
On the weekly chart, the price is actively breaking through the Opposite Descending Fan and is currently testing the level of 0.9670 (retracement of 61.8%), but has not consolidated above it yet. If successful, the growth of the trading instrument may continue to the levels of 0.9900 (the area of March 2020 highs) and 1.0192 (retracement of 100.0%). Otherwise, a corrective decline to the levels of 0.9510 (retracement of 50.0%) and 0.9350 (retracement of 38.2%) is possible. The uptrend in the asset continues, which is signaled by an upward reversal of Bollinger Bands and Stochastic, as well as an increase in the MACD histogram in the positive zone; however, the price chart leaving the upper Bollinger Band does not exclude a downward correction.

usdchf-chart-2.png


In the near future, a downward correction to the levels of 0.9572 (retracement of 23.6%, D1) and 0.9510 (retracement of 50.0%, W1) is possible. If the price consolidates above 0.9758 (the Opposite Descending Fan line of 61.8%, W1), USDCHF will probably continue to strengthen towards 0.99 (the March 2020 highs area) and 1.0192 (retracement of 100.0%, W1).

Resistance levels: 0.9758, 0.99, 1.0192 | Support levels: 0.967, 0.9572, 0.951​
 
usdcad-forum-1.png


The Canadian currency continues to resist the active growth of the US dollar, receiving support after the publication of data on Gross Domestic Product (GDP). At the moment, the quotes of USDCAD are trading in a local uptrend at around 1.2869.

Thus, according to the statistics presented, Canada's economy grew by 1.1% in February, which is the best indicator since March 2021. Experts also note a significant strengthening of the services sectors (by 0.9%) and the production of goods (by 1.5%). Sixteen out of twenty industries grew in this period, and preliminary data show that in March, the country's GDP may continue its positive dynamics and add another 0.5% due to the recovery of the national tourism market, as coronavirus restrictions were significantly eased. More than one million tourists visited Canada in the middle of last month for the first time since the pandemic, according to the Canada Border Services Agency (CBSA). As for the quarterly GDP indicator, the preliminary forecast indicates a possible growth of 1.4%, which may also have a positive impact on the national currency.

usdcad-gdp.png


Meanwhile, the US dollar is still holding above 103.000 in the USD Index after Friday's release of macroeconomic statistics. The Labor Cost Index in Q1 increased by 1.4% from 1.0%, which exceeded the 1.1% expected by analysts, and the Earnings index rose by 1.20%, having risen by 1.00% a quarter earlier, while the annual Personal Consumption Expenditure Index stood at 6.6 points in March, outperforming February's 6.3 points.

usdcad-chart.png


On the daily chart, the price continues to trade within a wide channel, actively approaching the resistance line. Technical indicators are holding a steady signal to open long positions: fast EMAs on the Alligator indicator are above the signal line, and the AO oscillator histogram is forming new ascending bars trading in the buy zone.

Support levels: 1.2798, 1.2448 | Resistance levels: 1.2937, 1.31​
 
nzdusd-forum-1.png


Market in anticipation of an increase in interest rates in the US
NZDUSD has been showing a downtrend since the end of last month, this week reaching its lowest levels since June 2020 around 0.6410. The pressure on the instrument is due to two main factors: the expectation of tightening of monetary policy by the US Federal Reserve and a decrease in prices for dairy products, which are New Zealand's main export goods.

On Wednesday, May 4, a meeting of the US Fed will be held, at which, as expected, the interest rate may be increased by 50 basis points, and it may also be announced that the regulator's balance sheet will be reduced, which will correct the record inflation growth in the country, that has reached forty-year high, and support the national currency. Many experts believe that a sharp increase in rates could lead to a recession in the US economy; moreover, according to preliminary data in Q1 2022, it has already decreased by 1.4%. However, US Fed officials hope that a significant decline will not happen and are ready to take risks, considering a significant increase in prices a more serious problem than a possible slowdown in economic development.

Meanwhile, milk prices have continued their downward correction since mid-March, shedding 3.6% despite a general increase in the cost of raw materials and food products. Today, the Global Dairy Trade will publish new statistics, and if the current trend continues, the New Zealand currency may be under significant pressure.

nzdusd.png


The price fell below 0.6470 (Murray [5/8], Fibonacci retracement 50.0%), which opens the way to 0.6347 (Murray [4/8]) and 0.6295 (Fibonacci retracement 61.8%). The key for the "bulls" seems to be the level of 0.6591 (Murray [6/8]), consolidation above which will allow the trading instrument to continue its upward movement to the area of 0.6714 (Murray [7/8], the center line of Bollinger Bands) and 0.6835 (Murray [8/8]). However, this option is less likely at the moment, as technical indicators show that the downtrend continues: Bollinger Bands are reversing downwards, MACD is increasing in the negative zone, and Stochastic is horizontal in the oversold zone.

Resistance levels: 0.6591, 0.6714, 0.6835 | Support levels: 0.6347, 0.6295​
 
eurgbp-forum-1.png


European currency under pressure
The euro continues to trade at extremely low levels against its major counterparts, with the exception of the US dollar. Quotes of EURGBP are currently being corrected around 0.8391.

Macroeconomic data published the day before were weak: the Manufacturing PMI of Italy fell in April to 54.5 points from 55.8 points last month, and the same indicator in Germany declined to 54.6 points from 56.9 points, and only in France the value remained unchanged at the level of 55.7 points. Thus, the Composite Manufacturing PMI for the EU countries amounted to 55.5 points, which coincided with the March statistics and signals a slowdown in the eurozone economy.

In turn, the British currency currently looks much more confident than the European one. Today, data on the UK Manufacturing PMI for April will be published, and if the actual data coincide with the analysts' forecast, which suggests that the figure will remain unchanged at 55.3 points, this may serve as additional support for the pound.

Meanwhile, the issue of energy security in the EU and the UK is becoming increasingly acute. At the end of last week, German Chancellor Olaf Scholz announced that the country would not use its veto power over the EU decision to declare an embargo on Russian oil. He also announced the readiness to stop the supply of Russian coal this summer and refuse to import oil until the end of the year against the backdrop of a serious reduction in the purchase of "blue fuel". Meanwhile, the UK Treasury Chancellor said at a meeting with representatives of energy companies that the government is considering the option of imposing an additional tax on enterprises that are not ready to invest in protecting energy security. With gas prices skyrocketing, market participants, in his opinion, should include funding for a package of measures for the design of alternative energy sources and reducing imports in their development plans, since bills for ordinary citizens have doubled in the last year alone and will continue to grow in the autumn, which led to to social tension. Thus, the UK Labor Party is calling for a lump-sum tax on excess profits earned by companies such as BP Plc. and Shell Plc.

eurgbp.png


The asset is trading within the global Diamond pattern, and after reaching the resistance line, it forms a reversal. Technical indicators are holding a global buy signal, which is starting to weaken: fast EMAs on the Alligator indicator started to converge, and the AO oscillator histogram is forming descending bars, being in the buy zone.

Support levels: 0.8359, 0.8251 | Resistance levels: 0.8463, 0.8587​
 
gbpusd-forum-1.png


GBPUSD, in anticipation of the meeting of the Bank of England
The pound shows flat trading dynamics against the US currency during the morning session on May 4, consolidating near the level of 1.2500. Traders are in no hurry to open new trading positions, preferring to wait for the publication of the US Fed Meeting Minutes. Analysts have little doubt that the key interest rate will be raised by 50 basis points at once; however, some of them allow for a correction by 75 basis points, citing record inflation over 40 years, as well as fairly stable trends in the labor market as arguments.

A meeting of the Bank of England will also take place this week, the result of which may be an increase in interest rates by 25 basis points to 1.00%, and by the end of 2022, experts predict an increase in the value in the range of 2–2.25%. Particular attention of traders will be riveted to the statement of the Governor of the regulator Andrew Bailey and his rhetoric regarding the steps of the financial authorities to curb inflationary pressure. Consumer prices in the United Kingdom are showing their fastest rate of growth in 30 years, already causing household incomes to plummet for the first time since 1956. It is estimated that electricity consumption for a typical British household this year will cost 620 pounds more than in 2021.

Macroeconomic statistics from the UK released yesterday provided additional support to GBP. The Manufacturing PMI from Markit in April rose from 55.3 to 55.8 points, which turned out to be better than the neutral forecasts of analysts, and the BRC Shop Price Index released today showed an acceleration year-on-year from 2.1 % to 2.7% in March, which coincided with analysts' estimates.

gbpusd-1.png


On the daily chart, Bollinger Bands are steadily declining. The price range is expanding, making way to new record lows for the "bears". MACD indicator is trying to reverse upwards and form a new buy signal (the histogram has to consolidate above the signal line). Stochastic, having shown corrective growth at the end of the last trading week is once again reversing into a horizontal plane, indicating an approximate balance of traders' sentiment in the ultra-short term.

Resistance levels: 1.25, 1.26, 1.2674, 1.28 | Support levels: 1.2400, 1.2334, 1.225, 1.22

gbpusd-2.png
 
morning-market-review.png


EURUSD
The European currency is showing multidirectional dynamics of trading in a pair with the US dollar during the Asian session, consolidating around 1.0500. Market activity remains subdued as traders await today's release of the US Federal Reserve's interest rate decision. Recall that the consolidated forecast assumes an increase in the indicator by 50 basis points at once, in addition, it is expected to announce the launch of a program to reduce the department's balance sheet by 9 trillion dollars. In turn, the European Central Bank (ECB) is still taking a wait-and-see position, despite the rapid growth of inflation in the region, although "hawkish" rhetoric is observed in the speeches of officials of this regulator as well. Earlier, the ECB executive board member, Isabel Schnabel, spoke in favor of the possibility of raising the rate in July, given that fuel and food prices will continue to increase. The macroeconomic statistics from Europe, published the day before, did not affect the dynamics of the instrument too much. Meanwhile, the Unemployment Rate in the euro area in March fell from 6.9% to 6.8%, which was only 0.1% worse than market expectations. The Producer Price Index confirmed the further acceleration of manufacturing inflation: in March, the indicator rose from 1.1% to 5.3%, and accelerated from 31.5% to 36.8% in annual terms.
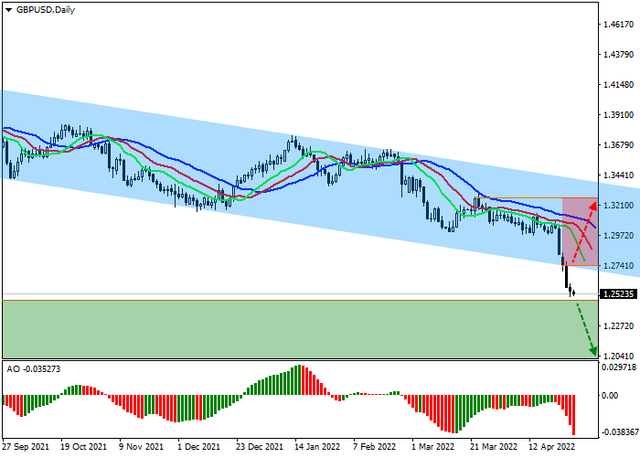
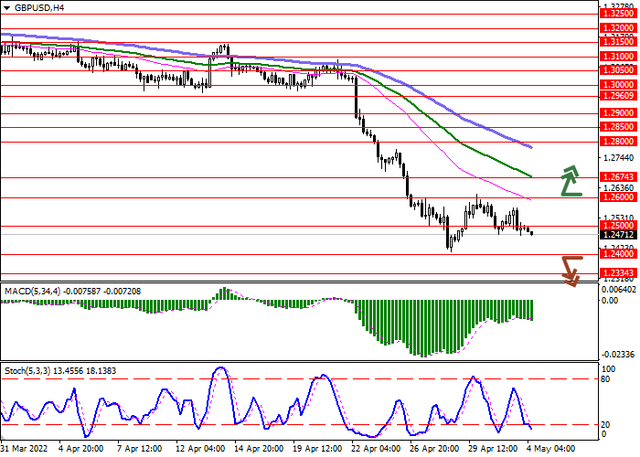
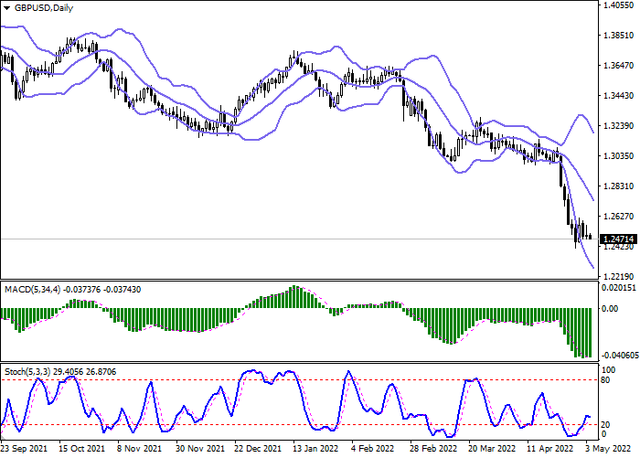
GBPUSD
The pound shows flat trading dynamics against the US currency during the morning session on May 4, consolidating near the level of 1.2500. Traders are in no hurry to open new trading positions, preferring to wait for the publication of the US Fed Meeting Minutes. Analysts have little doubt that the key interest rate will be raised by 50 basis points at once; however, some of them allow for a correction by 75 basis points, citing record inflation over 40 years, as well as fairly stable trends in the labor market as arguments. Macroeconomic statistics from the UK released yesterday provided additional support to GBP. The Manufacturing PMI from Markit in April rose from 55.3 to 55.8 points, which turned out to be better than the neutral forecasts of analysts, and the BRC Shop Price Index released today showed an acceleration year-on-year from 2.1% to 2.7% in March, which coincided with analysts' estimates.
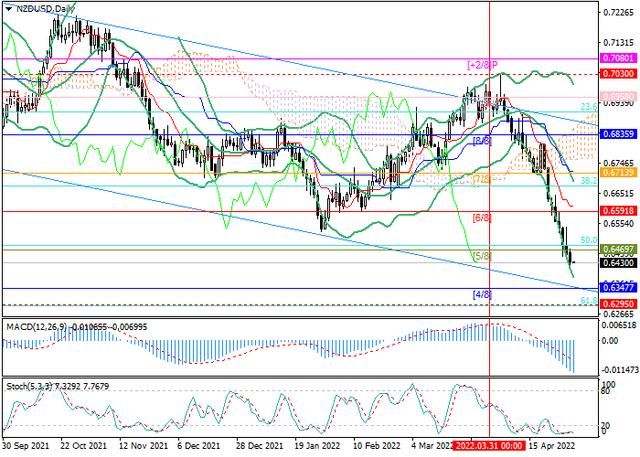
NZDUSD
The New Zealand dollar is slightly strengthening its position, recovering from the "bearish" start of the trading week, which led to the renewal of record lows since June 2020. Investors are cautious and do not rush to open new trading positions in anticipation of the publication during the day of the final minutes of the two-day meeting of the US Federal Reserve, at which the key interest rate is expected to be increased immediately by 50 basis points. As for the New Zealand macroeconomic statistics, it failed to provide significant support for the instrument quotes. The Unemployment Rate remained at the level of 3.2%, while the Participation Rate decreased from 71.1% to 70.9%, and the Employment Change increased by only 0.1% in the quarterly terms.

USDJPY
The trading instrument shows mixed dynamics, remaining close to the record highs updated at the end of last week. Now the USD/JPY pair is testing 130.00 for a breakout; however, the "bulls" prefer to wait for the US Federal Reserve meeting, at which the rate can be raised immediately by 50 basis points. The markets have already included such an outcome in the current quotes of the instrument, and therefore a noticeable increase in the US currency may not follow. However, officials' comments will continue to be extremely important for assessing the situation in the near future. In addition, the possibility of a rate increase by 75 basis points is not ruled out, although this scenario remains unlikely. Japanese markets are closed on Wednesday due to the national holidays, and therefore new drivers for the movement of the trading instrument will appear only at the end of the week, when the April statistics on consumer price dynamics in the Tokyo region will be published.

XAUUSD
Gold prices are consolidating near the level of 1865.00 after an attempt at corrective growth the day before, which did not allow XAU/USD to consolidate on new local lows from February 16. The pressure on quotes is exerted by the growth in the yield of US Treasury bonds: the indicator for 10-year bonds last Monday exceeded 3% for the first time since December 2018 and remains in this area at the present time. The investment attractiveness of the precious metal is decreasing before the start of the US Federal Reserve's meeting on monetary policy, which will be held today at 20:00 (GMT+2). US officials are expected to raise interest rates by 50 basis points at once, and also announce the launch of a quantitative tightening program, which should help to reduce the almost 9 trillion dollars balance sheet. Higher short-term interest rates and US bond yields tend to increase the opportunity cost of holding zero-yield bullion.​
 
Back
Top