Tifia Forex Broker Daily Market Analytics, Analytics and trading recommendations by Tifia Company

USD/CAD: on the eve of the NFP publication

07/02/2020

Current Dynamics


Today, the attention of market participants will be riveted to the publication at 13:30 (GMT) of data from the US labor market. Strong data expected. According to a report by the US Department of Labor, in January, 160,000 new jobs were created, salaries increased by 0.3%, and unemployment remained at the level of multi-year lows of 3.5%.

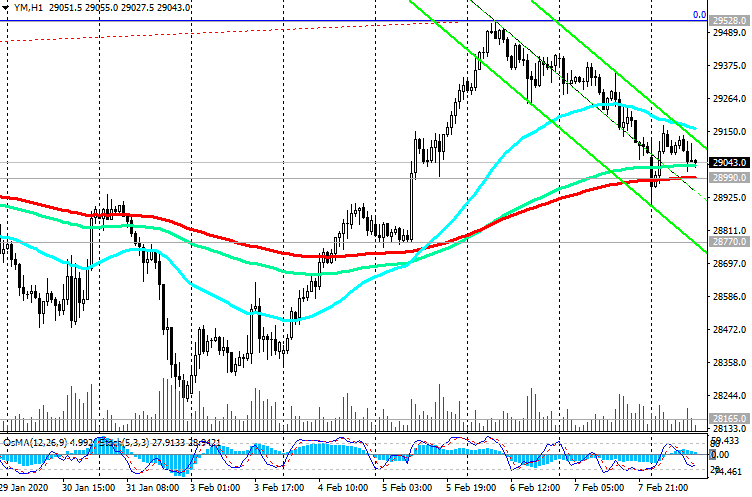
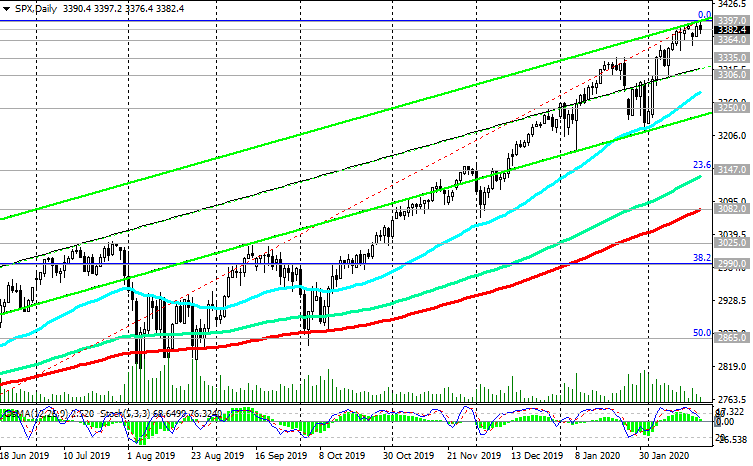
If the data is confirmed or is better than the forecast, then the dollar is likely to strengthen and US stock indices will rise. At the same time, you must be prepared for unexpected data that can cause increased volatility in the financial market. If the data on the labor market published today turn out to be weaker than the forecast, and previous reports will be revised downward, then the dollar may drop sharply.

Also at the same time (at 13:30 GMT) Statistics Canada will present its monthly report on the labor market in the country. Unemployment is expected to be 5.6% in January, the same as in December, and the number of employed increased by 15,000 (against 27,300 in December). If the data turn out to be better than the previous values or forecast, then the Canadian dollar is likely to strengthen, including with respect to the USD.

In any case, when data from the US and Canada labor markets are published, a surge in volatility is expected across the entire financial market. This will especially affect the USD / CAD pair, which grew in the first half of today's trading day, primarily due to the strengthening of the US dollar.

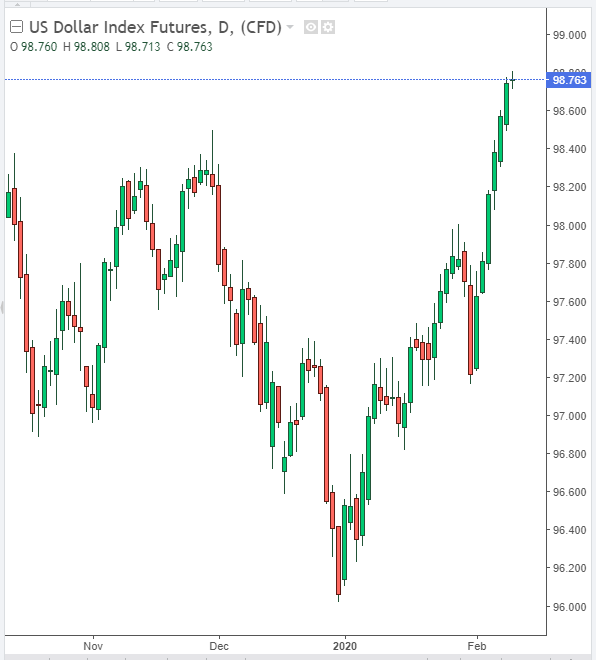
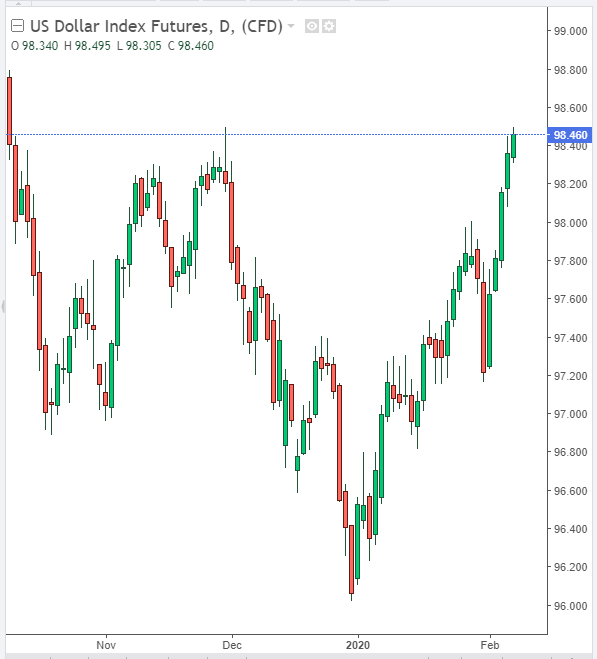
Futures on the DXY dollar index, which reflects the value of the dollar against a basket of 6 major world currencies, is growing today for the 5th day in a row and is trading at the beginning of today's European session near 98.46, 125 points higher than the closing price at the end of last week.

The dollar is strengthened by strong macro statistics coming from the United States, as well as the demand for it as a protective asset amid the spread of coronavirus in China.

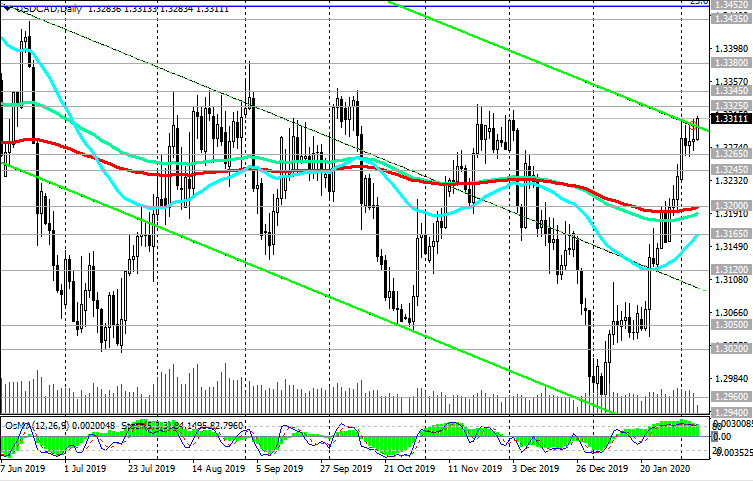
At the beginning of today's European session, USD / CAD is trading near 1.3310, 85 pips above its opening price earlier this week.

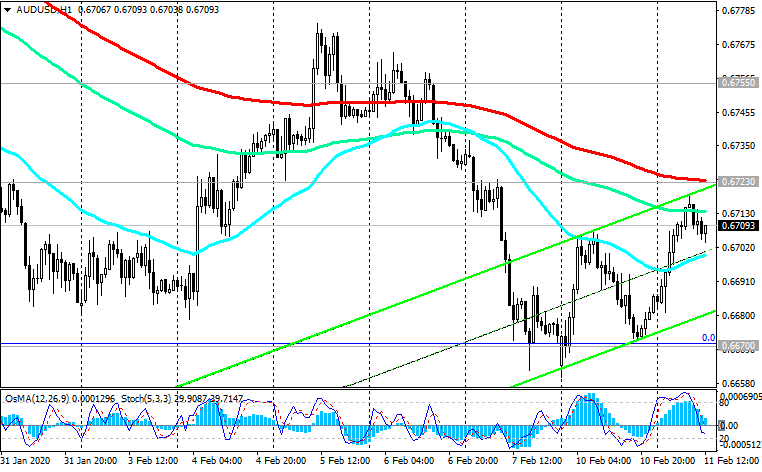
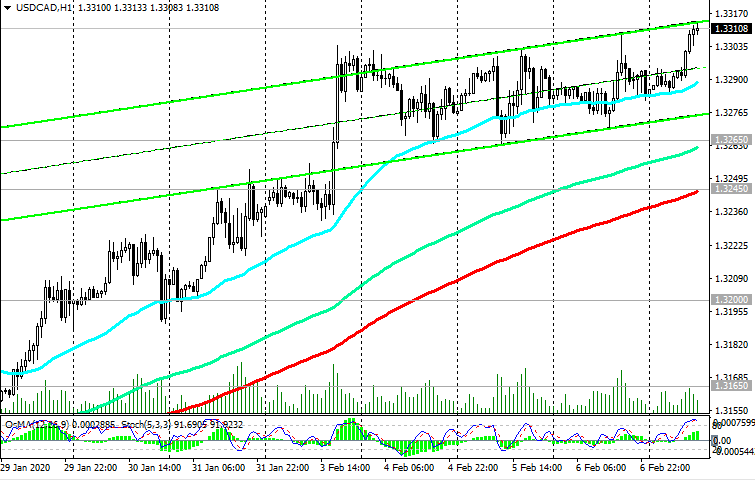
So far, everything speaks in favor of further growth of USD / CAD. Nevertheless, it should be noted that the pair has reached the upper limit of the range located between the levels of 1.3345 (1.3380) and 1.3020 (1.3050). Near these resistance levels, if not a reversal, then rebound with a subsequent decrease is possible. A signal for sales may be a breakdown of the local support level 1.3265 and the short-term support level 1.3245 (ЕМА200 on the 1-hour chart).

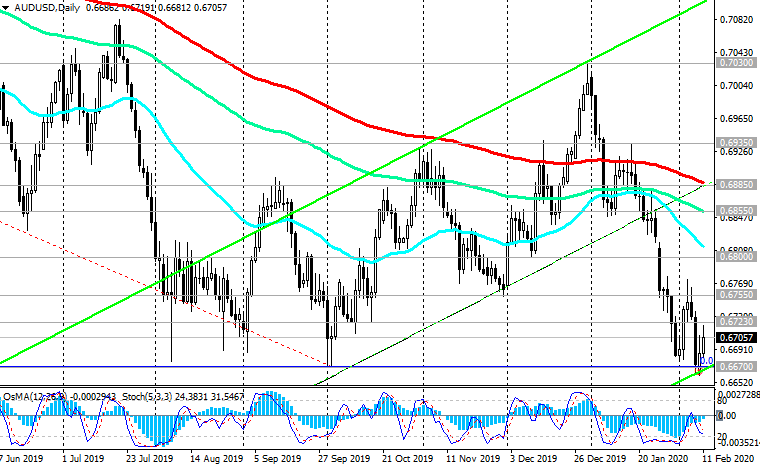
Nevertheless, while USD / CAD is trading above the key support level of 1.3200 (ЕМА200 on the daily chart), long positions should be preferred.

Support Levels: 1.3265, 1.3245, 1.3200, 1.3165, 1.3120, 1.3050, 1.3020

Resistance Levels: 1.3325, 1.3345, 1.3380, 1.3400, 1.3452


Trading Scenarios


Sell Stop 1.3025. Stop-Loss 1.3100. Take-Profit 1.3000, 1.2960, 1.2930

Buy Stop 1.3105. Stop-Loss 1.3025. Take-Profit 1.3120, 1.3190, 1.3300, 1.3325, 1.3345, 1.3380, 1.3400

070220-DXY.png


070220-UCD-DD.png


070220-UCD-H1.png


*) For up-to-date and detailed analytics and news on the forex market visit Tifia Forex Broker website tifia.com
 
DJIA: Current Situation

10/02/2020


Chinese President Xi Jinping last week assured US President Trump of China's intention to fulfill the obligations of a recently signed trade deal.

US Federal Reserve Chairman Jerome Powell said last week that the rapid spread of the virus will inevitably affect the Chinese economy and may affect the US economy, although it’s too early to judge the strength and magnitude of this influence.

This week (on Tuesday and Wednesday) Powell will speak in Congress as part of a statutory hearing. Probably, he will again touch upon the monetary policy of the Fed and the spread of coronavirus, which may cause increased volatility in world financial markets, including the US stock market.

On Friday, US stock markets closed in negative territory. The Dow Jones Industrial Average fell by -0.9%, to 29102, the S&P 500 - by -0.5%, to 3327, and the Nasdaq 100 - by -0.5%, to 9401.

Concerns over the spread of coronavirus in China nevertheless raise concerns about global growth. Fed officials call this an "unpredictable factor".

Nevertheless, the positive mood of investors related to the signing of the “first phase” trade agreement between the USA and China last month helps to maintain the positive dynamics of world and US stock indices, despite the epidemic of coronavirus in China.

Last week, the DJIA updated its absolute high near 59528.0, and at the beginning of today's European session, it is trading near 29070.0 mark.

Above the short-term support levels of 28990.0 (ЕМА200 on the 1-hour chart), 28770.0 (ЕМА200 on the 4-hour chart), the purchases look safe.

In an alternative scenario, the first signal for sales will be a breakdown of the short-term support level of 28899.0 (ЕМА200 on the 1-hour chart). In case of further decline, the targets will be the support levels 28770.0, 28165.0 (January lows), 27400.0 (ЕМА200 on the daily chart).

However, only a breakdown of the support level of 24150.0 (EMA200 on the weekly chart and the Fibonacci level 38.2%) can break the DJIA bullish trend.

Despite the corrective decline, the long-term positive dynamics of the DJIA remains, which makes its purchases preferable.

Support Levels: 28990.0, 28770.0, 28165.0, 27400.0, 26220.0, 25270.0, 24600.0, 24150.0

Resistance Levels: 29528.0


Trading Scenarios


Buy Stop 29530.0. Stop-Loss 28760.0. Take-Profit 30000.0

Sell Stop 28760.0. Stop-Loss 29175.0. Take-Profit 28165.0, 28000.0, 27400.0

100220-DJIA-D.png


100220-DJIA-H1.png


*) For up-to-date and detailed analytics and news on the forex market visit Tifia Forex Broker website tifia.com
 
AUD/USD: negative dynamics prevail

11/02/2020


At the start of today's European session, AUD / USD is trading near the 0.6710 mark, just below the intraday high of 0.6719 reached during the Asian session after the publication of positive macro statistics from Australia.

According to the Australian Bureau of Statistics, the volume of issued housing loans increased in December by + 4.4% (with a forecast of + 1.6%), and the volume of issued housing loans related to investment grew in December by + 2.8%.

In total, in 2019, mortgage lending in Australia grew by + 14%, and this year the growth is likely to accelerate, some economists say. Such a development of events will attract the attention of the leaders of the Reserve Bank of Australia and make them reduce the tendency to further soften the policy of the bank.

Nevertheless, most economists believe that the RBA will be forced to return to the issue of lowering rates this year, despite the risks of overheating the housing market in the country.

"Forest fires and coronavirus will temporarily put pressure on growth in Australia in the short term. We are ready to continue easing monetary policy if it is necessary to support sustainable economic growth," said RBA managing director Philip Low last week.

Meanwhile, the DXY dollar index rose Monday for the sixth consecutive session and, supported by strong US employment data and concerns over the spread of coronavirus, rose on Tuesday to a 4-month high of 98.80.

The AUD / USD pair is trading below the nearest strong resistance levels of 0.6723 (ЕМА200 on the 1-hour chart), 0.6800 (ЕМА200 on the 4-hour chart), remaining in the area below the key resistance level 0.6885 (ЕМА200 on the daily chart) and maintaining negative dynamics.

OsMA and Stochastic indicators on the daily and weekly charts are on the side of the sellers.

Probably, the possible correctional growth of AUD / USD will be limited by the resistance levels of 0.6723, 0.6755, 0.6800.

In the event of a breakdown of the support level of 0.6670 (2019 lows and a Fibonacci level of 0%) and the resumption of decline, the goals will be the support levels of 0.6600, 0.6500. The distant target is located at support levels of 0.6260, 0.6000 (lows of 2008 - 2009).

So far, the negative dynamics of AUD / USD, which speaks in favor of its sales, still prevails.

On Tuesday and Wednesday, participants in financial markets will follow the speech of US Federal Reserve Chairman Jerome Powell in Congress (at 15:00 GMT).

He is likely to once again mark the “good form” of the American economy, and most likely the US dollar will maintain positive dynamics this week.

Support Levels: 0.6700, 0.6670, 0.6600, 0.6300

Resistance Levels: 0.6723, 0.6755, 0.6800, 0.6855, 0.6885, 0.6900, 0.6935


Trading Recommendations


Sell by market. Stop-Loss 0.6725. Take-Profit 0.6670, 0.6600, 0.6300

Buy Stop 0.6725. Stop-Loss 0.6675. Take-Profit 0.6755, 0.6800, 0.6855, 0.6885

110220-DXY.png


110220-AU-D.png


110220-AU-H1.png


*) For up-to-date and detailed analytics and news on the forex market visit Tifia Forex Broker website tifia.com
 
NZD/USD: concerns over coronavirus weaken

12/02/2020


As soon as today at 01:00 (GMT) the RBNZ decision on the rate was published, the New Zealand dollar strengthened sharply.

The New Zealand Reserve Bank seems to be beginning to show a tendency towards tighter monetary policy amid the release of data indicating an improvement in the country's economy and lower risks of a slowdown in the global economy due to coronavirus in China.

A statement made after the meeting of the RBNZ indicates that the central bank considers the risks associated with the outbreak of coronavirus not serious enough to significantly affect its position on monetary policy.

RBNZ forecasts suggest that if the negative consequences of a coronavirus outbreak on economic growth do not exceed expectations, the next step is likely to be not a decrease, but an increase in the interest rate.

After the RBNZ meeting, the NZD / USD pair increased by 50 points, and at the beginning of today's European session, NZD / USD is trading near 0.6485, which is 85 points higher than the opening price today.

The immediate goal in case of continued growth of NZD / USD is the resistance levels of 0.6525 (EMA200 on the 4-hour chart), 0.6535 (EMA200 on the daily chart).

In case of their breakdown, NZD / USD will go towards the resistance levels of 0.6755 (EMA144 on the weekly chart), 0.6865 (EMA200 on the weekly chart and the Fibonacci level 23.6% of the correction in the global wave of pair decline from the 0.8820 mark).

At the same time, below the key resistance level of 0.6535, long-term negative dynamics prevail.

A return into the zone below the level of 0.6450 (EMA200 on the 1-hour chart) will cause a resumption of NZD / USD decline with targets at support levels of 0.6400, 0.6322 (November lows), 0.6260 (September 2015 lows and Fibonacci level 0%), 0.6205 (September lows).

Powell will continue his congressional speech Wednesday. It will begin at 15:00 (GMT). On Tuesday, he reiterated that "if a situation arises that will cause a significant reassessment of our forecasts, we will respond accordingly". If Powell speaks out more specifically regarding the need for a softer monetary policy by the Fed, the US dollar may fall under sales after its 7-day rise the day before.

In this case, the NZD / USD pair will receive an additional impetus for further growth.

Support Levels: 0.6465, 0.6450, 0.6400, 0.6378, 0.6322, 0.6260, 0.6200, 0.6100

Resistance Levels: 0.6485, 0.6515, 0.6525, 0.6535, 0.6600, 0.6635, 0.6665, 0.6755, 0.6865


Trading Scenarios


Sell Stop 0.6445. Stop-Loss 0.6485. Take-Profit 0.6400, 0.6378, 0.6322, 0.6260, 0.6200, 0.6100

Buy Stop 0.6490. Stop-Loss 0.6445. Take-Profit 0.6515, 0.6525, 0.6535, 0.6600, 0.6635, 0.6665, 0.6755, 0.6865

120220-NU-D.png


120220-NU-H1.png


*) For up-to-date and detailed analytics and news on the forex market visit Tifia Forex Broker website tifia.com
 
EUR/USD: negative dynamics persist

13/02/2020


According to the quarterly report submitted by the European Commission on Thursday, the eurozone's total GDP will grow by 1.2% in both 2020 and 2021. Thus, the European Commission confirmed the forecasts presented in November 2019.

Among the main risks, the European Commission indicated an outbreak of coronavirus and the uncertainty of US foreign trade policy.

The downward risks for the economic outlook were somewhat weakened after the conclusion of the first-phase trade agreement between China and the USA, as well as after the EU and Great Britain managed to avoid Brexit without a deal. However, uncertainty persists, and new sources of risk have emerged, one of which is coronavirus.

"The economy of the Eurozone may receive support from a softer and more stimulating fiscal policy, and will also be positively affected by soft financial conditions in some countries", the European Commission added.

The inflation forecast for 2020 was raised to 1.3% from 1.2%, and the forecast for 2021 - to 1.4% from 1.3%.

The head of the ECB Christine Lagarde also spoke in January about the negative impact on the economy of the Eurozone by the protectionist policy of the United States.

During a January 23 press conference, Lagarde said the Eurozone economy is facing "downside risks" due to increased protectionism, bearing in mind, among other things, the threat of US President Donald Trump to impose import duties on European cars.

Great Britain left the EU on January 31, however, internal political tensions and uncertainty in the Eurozone remain, but there are no significant signs of a recovery in Europe’s manufacturing sector.

It is possible that the ECB will be forced to resort to additional incentive measures, which will further weaken the euro. A recent ECB report suggests that rates could be reduced to -1% or even lower.

For the euro, a negative fundamental background prevails so far, creating the prerequisites for a further weakening of the euro.

EUR / USD is trading in a zone well below the key resistance level of 1.1128 (ЕМА200 on the daily chart), and so far no recovery is expected. Long-term negative dynamics of EUR / USD remains, which speaks in favor of short positions.

To resume growth, the price needs to break through the nearest resistance levels of 1.0953 (ЕМА200 on the 1-hour chart), 1.1035 (ЕМА200 on the 4-hour chart).

Support Levels: 1.0850, 1.0800

Resistance Levels: 1.0895, 1.0953, 1.0995, 1.1035, 1.1092, 1.1128


Trading Recommendations


Sell Limit 1.0890, Sell Stop 1.0860. Stop-Loss 1.0910. Take-Profit 1.0800, 1.0700, 1.0600

Buy Stop 1.0955. Stop-Loss 1.0920. Take-Profit 1.0953, 1.0995, 1.1035, 1.1092, 1.1128

130220-EU-D.png


130220-EU-H1.png


*) For up-to-date and detailed analytics and news on the forex market visit Tifia Forex Broker website tifia.com
 
WTI: long positions so far premature

14/02/2020


After falling sharply last month amid the spreading coronavirus infection in China, oil prices seem to have stabilized in February. Investor fears about the massive spread of coronavirus have declined. The rate of spread of the disease appears to be slowing. Expectations for China's economic recovery to recover in the 2nd quarter after falling in the 1st quarter due to coronavirus are supporting commodity prices, including oil.

At the beginning of the European session, WTI crude oil is trading near 51.50, above the short-term support level (ЕМА200 on the 1-hour chart).

The next target in case of continued growth will be the resistance levels 54.40 (EMA200 on the 4-hour chart), 55.40 (Fibonacci level 38.2% of the upward correction to the fall from the highs of the last few years near 76.80 to the support level near 42.15). Nevertheless, talking about the resumption of the bull trend is still premature. If investors again begin to receive information about the growing number of patients with coronavirus in China, then global stock indices and commodity prices will again come under pressure. Coronavirus is still the main topic.

A signal for sales will be a breakdown of the support level 51.20 (ЕМА200 on the 1-hour chart). Breakdown of the next important support level of 50.30 (Fibonacci level of 23.6%) will increase pressure on the price towards its further decline with a long-term goal at support level 42.15 (Fibonacci level of 0% and December 2018 lows).

Today, investors and oil market participants will pay attention to the publication (at 18:00 GMT) of the next weekly report of the American oilfield services company Baker Hughes. According to the latest report, the number of active drilling rigs in the US has grown over the past month by just 6 rigs, to 676 units. A decline in demand from China and an increase in US oil reserves will put pressure on US oil producers. If the Baker Hughes report indicates a decrease in the number of active rigs, this could give a short-term positive impetus to prices.

Support Levels: 51.20, 50.30, 49.00, 42.15

Resistance Levels: 53.00, 54.40, 55.40, 56.80, 59.50, 60.90, 63.50, 64.40, 66.50


Trading Recommendations


Sell Stop 50.90. Stop-Loss 52.10. Take-Profit 50.30, 49.00, 42.15

Buy Stop 52.10. Stop-Loss 50.90. Take-Profit 53.00, 54.40, 55.40, 56.80, 59.50, 60.90, 63.50, 64.40, 66.50

140220-WTI-D.png


140220-WTI-H1.png


*) For up-to-date and detailed analytics and news on the forex market visit Tifia Forex Broker website tifia.com
 
GBP/USD: the pound strengthened. What's next?

17/02/2020


The pound strengthened sharply last week, while the GBP / USD pair rose to an intra-week high near 1.3069. The reason was the report of new rearrangements in the office of British Prime Minister Boris Johnson. New Finance Minister Rishi Sunak is a staunch supporter of Brexit, lower corporate taxes and capital gains taxes. According to some economists, its appointment may strengthen upward factors for the pound.

However, further growth of the pound and GBP / USD may be difficult.

In the long run, Brexit is still a negative factor for the pound. The UK is unlikely to receive significant preferences or benefits as a result of new international trade agreements.

At the same time, new data on inflation and employment in the UK expected this week may put downward pressure on the pound. These indices will be published on Tuesday and Wednesday (at 09:30 GMT).

Since the opening of today's trading day, GBP / USD has been trading in a narrow range near 1.3030, above important support levels 1.3025 (ЕМА200 on the 4-hour chart), 1.3000 (ЕМА200 on the 1-hour chart), 1.2850 (ЕМА200 on the daily chart), while maintaining a positive the dynamics.

The breakdown of the local resistance level of 1.3069 will provoke further growth of GBP / USD towards the resistance levels of 1.3210 (Fibonacci level 23.6% of the correction to the GBP / USD decline in the wave that began in July 2014 near the level of 1.7200), 1.3310 (EMA200 on the weekly chart).

In an alternative scenario, the breakdown of support levels 1.3025, 1.3000 will be a signal for sales and lower GBP / USD to support level 1.2850.

Today is the day off in the USA (Presidents' Day). In view of this, trading volumes during the American session will be low, which, however, does not exclude the possibility of a sharp short-term increase in volatility in the thin market.

Support Levels: 1.3025, 1.3000, 1.2850, 1.2400, 1.2200, 1.2000

Resistance Levels: 1.3069, 1.3210, 1.3310, 1.3510, 1.3960


Trading Scenarios


Sell Stop 1.2985. Stop-Loss 1.3075. Take-Profit 1.2955, 1.2910, 1.2850

Buy Stop 1.3075. Stop-Loss 1.2985. Take-Profit 1.3100, 1.3210, 1.3310, 1.3510

170220-GU-D.png


170220-GU-H1.png


*) For up-to-date and detailed analytics and news on the forex market visit Tifia Forex Broker website tifia.com
 
AUD/USD: downward trend prevails

18/02/2020


The publication of protocols from the February meeting of the RBA at the beginning of today's Asian session caused a drop in the Australian dollar and the pair AUD / USD. At a meeting on February 4, the RBA board decided to leave interest rates unchanged, at a record low of 0.75%. However, "there is reason to expect a lower key rate", said RBA head Philip Lowe. At the same time, “coronavirus is a new source of uncertainty”, the RBA management believes.

According to bank executives, "the epidemic poses a significant short-term economic risk for China and international trade flows, and therefore for the Australian economy".

Now, investors will follow the publication (on Wednesday and Thursday at 00:30 GMT) of data from the country's labor market in order to determine the further exchange rate of RBA interest rates and, accordingly, the dynamics of AUD. According to the forecast, unemployment is expected to increase in January to 5.2% from 5.1% in December. This is a negative factor for AUD.

Meanwhile, at the beginning of today's European session, AUD / USD is trading near 0.6680, below the key resistance level of 0.6880 (EMA200 on the daily chart), which indicates the prevalence of a downward global trend.

Only after growth into the zone above short-term important resistance levels of 0.6720 (ЕМА200 on the 1-hour chart), 0.6780 (ЕМА200 on the 4-hour chart) can we return to the consideration of long positions with the target at the resistance level 0.6880.

Negative dynamics of AUD / USD prevails, speaking in favor of its sales.

In case of resumption of decline, the targets will be the support levels of 0.6600, 0.6500, 0.6260, 0.6000 (lows of 2008 - 2009).

Support Levels: 0.6670, 0.6660, 0.6600, 0.6300

Resistance Levels: 0.6720, 0.6755, 0.6780, 0.6800, 0.6845, 0.6880, 0.6935


Trading Recommendations


Sell Stop 0.6665. Stop-Loss 0.6725. Take-Profit 0.6600, 0.6300, 0.6260

Buy Stop 0.6725. Stop-Loss 0.6665. Take-Profit 0.6755, 0.6780, 0.6800, 0.6845, 0.6880, 0.6935

180220-AU-D.png


180220-AU-H4.png


180220-AU-H1.png


*) For up-to-date and detailed analytics and news on the forex market visit Tifia Forex Broker website tifia.com
 
EUR/USD: when will the fall of the euro stop?

19/02/2020


Macro data published at the beginning of yesterday's European session testified to the growing fears of European investors regarding the spread of coronavirus in China and the worsening business climate in Germany and the Eurozone.

The ZEW Institute reported a fall in the index of economic expectations in Germany in February to 8.7 (against 26.7 in January and a forecast of 21.5) and an economic sentiment index in the Eurozone to 10.4 (against 25.6 in January and a forecast of 30).

The EUR / USD completed the last trading day near the level 1.0789, reaching the lowest level since April 2017.

However, a deeper decline in EUR / USD has not yet been observed. On Wednesday, the pair is trading in a narrow range near the critical level of 1.0800 in anticipation of new drivers, either for corrective growth or for further decline.

It is noteworthy that in the first half of today's trading day there is an increase in the euro in cross-pair with the pound. If the strengthening of the euro extends to other important cross-pairs, we can seriously consider the likelihood of resumption of growth and the EUR / USD.

The first signal to resume purchases of EUR / USD will be a breakdown of the short-term resistance level of 1.0873 (ЕМА200 on the 1-hour chart).

So far, the long-term negative dynamics of EUR / USD. A breakdown of the local support level of 1.0790 will speak in favor of short positions and a decrease in EUR / USD towards the lows of March 2015 and the level of 1.0480 (Fibonacci level 0% of the upward correction to the fall of the pair from 1.3870 in May 2014 to 1.0480 reached in March 2015).

On Wednesday, investors will follow the publication (at 19:00 GMT) of the protocol from the January meeting of the Fed. In January, the Fed kept interest rates unchanged and signaled its intention to maintain them at their current level in the near future. The Fed also announced that it will continue to purchase treasury bonds in the 2nd quarter of 2020 and intervene in the repo markets. If the protocols contain new information signaling the Fed’s propensity for a softer policy, then the dollar, which has strengthened significantly in recent days, may decline, which will become a good positive driver for the so far correctional growth of EUR / USD.

Support Levels: 1.0790, 1.0800

Resistance Levels: 1.0815, 1.0873, 1.0900, 1.0945, 1.0990, 1.1080, 1.1115


Trading Recommendations


Sell Stop 1.0780. Stop-Loss 1.0825. Take-Profit 1.0700, 1.0600

Buy Stop 1.0825. Stop-Loss 1.0780. Take-Profit 1.0873, 1.0900, 1.0945, 1.0990, 1.1080

190220-EU-D.png


190220-EU-H1.png


*) For up-to-date and detailed analytics and news on the forex market visit Tifia Forex Broker website tifia.com
 
S&P500: long positions are still relevant

20/02/2020


During today's Asian session, the S&P500 updated another record high near 3397.0 mark. Demand for US assets remains. In the current situation of the spread of coronavirus and the slowdown of the Chinese and global economies, the US economy looks most stable. During the January meeting, the Fed signaled increased optimism about the US economy. According to the minutes published Wednesday, Fed leaders "saw an improvement in the balance of risks for economic prospects compared to the previous meeting".

Demand for US assets is growing. So, according to data released last Tuesday, net purchases of US long-term securities by foreign investors in December amounted to $ 85.6 billion, which is $ 60 billion higher than forecast. Economists believe that in the second half of the year the results of American companies will improve.

This, along with expectations of a softer monetary policy by the Fed, creates the prerequisites for further growth of US stock indices.

So, the Dow Jones Industrial Average on Wednesday trades increased by 0.4% to 29348.00 points, the S&P 500 grew by 0.5%, to a new record high of 3386.00 points, the Nasdaq Composite jumped 0.9% to 9817.00, also a new record high.

In the event of a breakdown of the local resistance level 3397.0, the S&P500 growth is likely to continue.

In an alternative scenario and after the breakdown of short-term support levels of 3364.0 (ЕМА200 on the 1-hour chart), 3306.0 (ЕМА200 on the 4-hour chart), the S&P500 correctional decline may continue to the support level 3250.0 (the lower border of the ascending channel on the daily chart and the highs of 2019). However, only a breakdown of support levels 3025.0 and 2990.0 (Fibonacci level 38.2%) will increase the risks of breaking the bullish trend of S&P500.

Today, investors will pay attention to the publication (at 13:30 GMT) of weekly data on the number of initial applications for unemployment benefits and the Conference Board index for January (at 15:00 GMT). This index represents the combined value of 10 economic indicators related to employment, new orders, consumer confidence, housing, stock market prices, lending trends and interest spreads. According to the forecast, the index is expected to grow by +0.4%, which is also a positive factor for US stock indices and the dollar.

The S&P500 index maintains a long-term positive trend. Above the support levels 3364.0, 3335.0, long positions are preferred.

Support Levels: 3364.0, 3335.0, 3306.0, 3250.0, 3147.0, 3082.0, 3025.0, 2990.0

Resistance Levels: 3397.0, 3400.0


Trading Recommendations


Sell Stop 3347.0. Stop-Loss 3398.0. Targets 3335.0, 3306.0, 3250.0, 3147.0

Buy Stop 3398.0. Stop-Loss 3347.0. Goals 3450.0, 3490.0

200220-s500-D.png


200220-s500-H1.png


*) For up-to-date and detailed analytics and news on the forex market visit Tifia Forex Broker website tifia.com
 
Back
Top