Tifia Forex Broker Daily Market Analytics, Analytics and trading recommendations by Tifia Company

GBP/USD: downtrend risk increased

21/02/2020


According to Markit Economics, the Purchasing Managers Index (PMI) in the UK manufacturing sector rose in February (51.9 against the forecast of 49.7 and 50.0 in January), reaching a 10-month high. The preliminary PMI for the UK services sector was forecast at 53.4 in February, but came out with a value slightly lower (53.3 against 53.9 in January).

Having received support from positive macro statistics, the pound strengthened, while the GBP / USD pair rose during the European session to an intraday high of 1.2951.

However, further growth of GBP / USD above the intraday high of 1.2951 did not follow. Investors are still cautious about positive macro data against the backdrop of Brexit and the spread of coronavirus in Asia.

The theme of coronavirus today again came to the fore. The growth in the number of new infected people in China and South Korea again raises concerns among investors, including the slowdown in global economic growth.

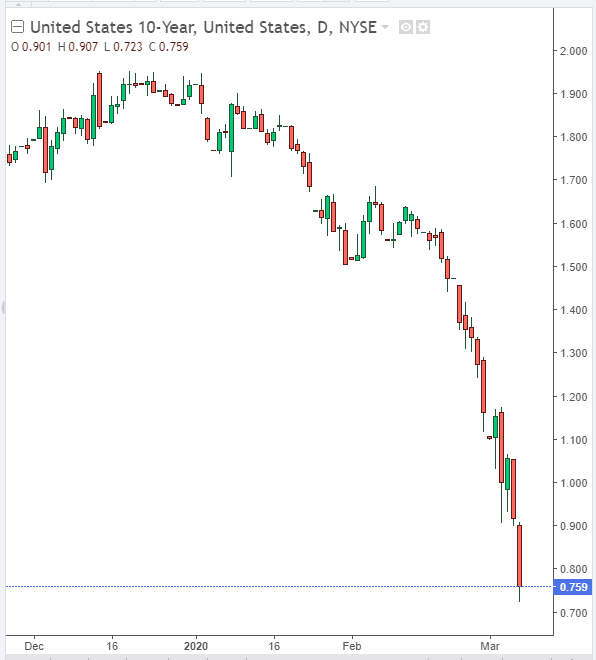
Economists also believe that the UK draft budget expected on March 11 will not contain plans for a significant fiscal stimulus to the economy, and the yield on UK 10-year government bonds by the 3rd quarter will fall by 40 basis points.

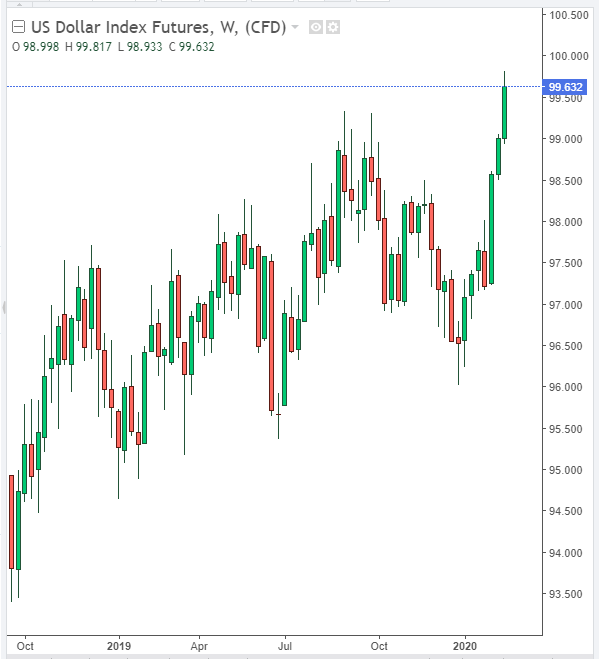
At the same time, the dollar continues to be in demand both as a defensive asset, and against the backdrop of positive macro statistics coming from the United States. Most likely, the DXY dollar index will finish in positive territory for the third week in a row.

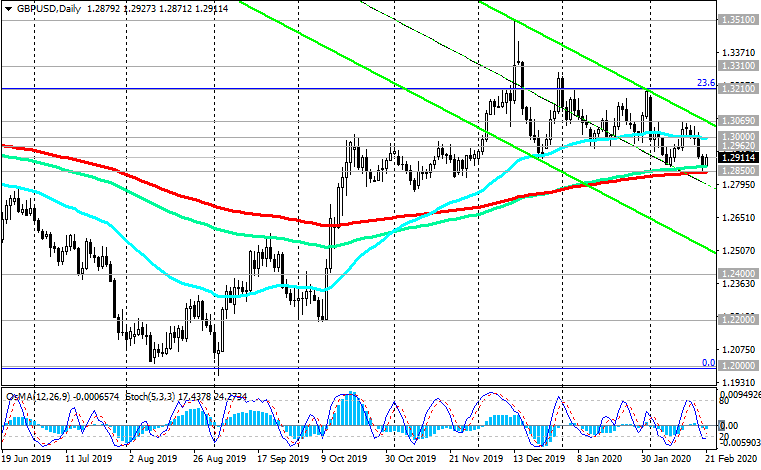
Despite the current growth of the GBP / USD pair, the OsMA and Stochastic indicators on the daily and weekly charts switched to the side of the sellers, signaling the likelihood of a breakdown of the key support level of 1.2850 (EMA200 on the daily chart) and the resumption of the global GBP / USD downtrend.

GBP / USD has already broken through important short-term support levels of 1.3000 and 1.2962, which speaks in favor of short short-term positions with an immediate goal at the support level of 1.2850.

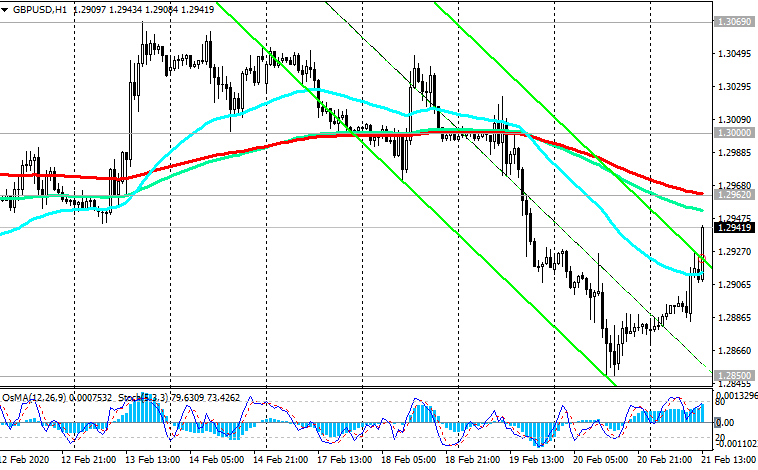
In an alternative scenario, and after the breakdown of resistance levels 1.2962 (ЕМА200 on the 1-hour chart), 1.3000 (ЕМА200 on the 4-hour chart) GBP / USD will resume upward trend and head towards the local resistance level 1.3069. Further growth of GBP / USD in the current situation is unlikely.

Support Levels: 1.2850, 1.2400, 1.2200, 1.2000

Resistance Levels: 1.2962, 1.3000, 1.3069, 1.3210, 1.3310, 1.3510, 1.3960


Trading Scenarios


Sell Stop 1.2890. Stop-Loss 1.2970. Take-Profit 1.2850, 1.2400, 1.2200, 1.2000

Buy Stop 1.2970. Stop-Loss 1.2890. Take-Profit 1.3000, 1.3069, 1.3210, 1.3310, 1.3510, 1.3960

210220-GU-D.png


210220-GU-H1.png


210220-DXY.png


*) For up-to-date and detailed analytics and news on the forex market visit Tifia Forex Broker website tifia.com
 
EUR/USD: short positions

25/02/2020


Amid continued investor concerns about the spread of coronavirus in China and its impact on the European economy, the decline in EUR / USD resumed on Tuesday. According to economists, in the 1st quarter of Germany's GDP growth may slow due to a reduction in exports and supply shortages, including from China and to China. 10% of intermediate goods for German factories come to Germany from China, while China accounts for about 6% of German exports. In China, the coronavirus epidemic has already affected production, export, and consumption levels. Now the virus has reached northern Italy, where more than 50,000 local residents were quarantined last Sunday.

The coronavirus epidemic directly threatens global economic growth, since the supply chain of many international enterprises depends on the supply of intermediate and finished products from China. Economists have warned that the global economy could miss $1 trillion of GDP.

For this reason, the dollar is likely to win, as many investors pay attention to it as a defensive asset along with traditional defensive assets (government bonds, gold).

Published at the beginning of yesterday's European session, the positive macro data on Germany could not decisively change the negative attitude towards the euro by investors.

At the beginning of today's European session, the EUR / USD broke through the short-term support level of 1.0843 (EMA200 on the 1-hour chart) and continues to decline towards recent multi-year lows near the 1.0775 mark reached last week.

Several factors of a fundamental and technical nature speak in favor of a further decline in EUR / USD towards the lows of March 2015 and the level of 1.0480 (Fibonacci level 0% of the upward correction to the fall of the pair from 1.3870 in May 2014 to 1.0480 reached in March 2015)

In this situation, short positions are preferable, even if the upward correction starts again. A signal for her will be a return to the zone above the resistance level of 1.0843.

Support Levels: 1.0800, 1.0775

Resistance Levels: 1.0843, 1.0873, 1.0900, 1.0945, 1.0990, 1.1100


Trading Recommendations


Sell by market. Stop-Loss 1.0880. Take-Profit 1.0775, 1.0700, 1.0600

Buy Stop 1.0880. Stop-Loss 1.0790. Take-Profit 1.0900, 1.0945, 1.0990, 1.1100

250220-EU-D.png


250220-EU-H1.png


*) For up-to-date and detailed analytics and news on the forex market visit Tifia Forex Broker website tifia.com
 
DJIA: negativity prevails

26/02/2020


The positive mood of investors related to the signing of the “first phase” trade agreement between the US and China last month changed to a pessimistic one due to the spread of coronavirus outside of China, which could have an even greater negative impact on the global economy.

Earlier this month, Chinese President Xi Jinping assured US President Trump of China's intention to fulfill the obligations of a recently signed trade deal. At the same time, Jerome Powell, Chairman of the US Federal Reserve System, said that the rapid spread of the virus will inevitably affect the Chinese economy and may affect the US economy.

And so, investors' fears intensified on Tuesday after reports of the further spread of coronavirus and warnings of the US Centers for Disease Control and Prevention (CDC) about a potential pandemic.

The S&P 500 fell another 0.3% on Tuesday to 3138.00 points, while the Nasdaq Composite lost 2.8%, reaching 8966.00 points, losing growth compared to the beginning of the year. Last week, the DJIA was trading near 29528.0, which corresponds to record and absolute highs. But today, at the beginning of the European session, DJIA futures are trading near the 26900.0 mark, 9.6% below last week's highs.

Protective assets are again in active demand. On Wednesday, the yield on 10-year US government bonds fell at the beginning of the European session to 1.321% (against 1.473% at the end of last week and against 1.576% at the beginning of last week), which corresponds to the lows of 2016. Gold quotes also resumed growth after falling on Tuesday.

DJIA broke through the important support level of 27546.0 (ЕМА200 on the daily chart) and at the beginning of today's European session it is traded near 27070.0.

It is not excluded that the index may decline further to support levels of 26220.0 (Fibonacci level 23.6% of correction to the DJIA growth wave that began in February 2016 from 15500.0), 25200.0 (August lows and ЕМА144 on the weekly chart), 24600.0 (June 2019 lows).

However, only a breakdown of the support level of 24150.0 (EMA200 on the weekly chart and the Fibonacci level 38.2%) can break the DJIA long-term bullish trend.

Growth into the zone above the resistance level of 27546.0 will revive the positive dynamics of the DJIA and once again make long positions relevant.

Support Levels: 26700.0, 26220.0, 25200.0, 24600.0, 24150.0

Resistance Levels: 27546.0, 27900.0, 28160.0, 28630.0, 28840.0, 29528.0


Trading Scenarios


Buy Stop 27350.0. Stop-Loss 26700.0. Take-Profit 27546.0, 27900.0, 28160.0, 28630.0, 28840.0, 29528.0

Sell Stop 26700.0. Stop-Loss 27350.0. Take-Profit 26220.0, 25200.0, 24600.0, 24150.0

260220-DJIA-W.png


D-260220-DJIA.png


*) For up-to-date and detailed analytics and news on the forex market visit Tifia Forex Broker website tifia.com
 
Brent: short positions

27/02/2020


Amid falling global stock indices due to investors' fears about the increased risks of the coronavirus pandemic, oil prices continue to decline. On Wednesday, the price of Brent crude oil broke through the bottom line of the upward channel on the weekly chart, passing through the mark of 53.50, and continued to decline in the first half of today's trading day. At the beginning of today's European session, Brent crude is traded near 52.40, falling in price for the 5th day in a row.

Prices are also falling amid disagreements between OPEC and Russia over oil production restrictions. Next week, the OPEC+ coalition summit will be held in Vienna. Saudi Arabia insists on a further reduction in total production; however, these proposals did not find support from Russia. If OPEC+ fails to agree on an additional reduction in production volumes, this will lead to an even larger decline in oil prices.

The oil market is dominated by bearish sentiment.

The price may receive support on Friday if the next weekly report of the American oilfield services company Baker Hughes indicates a decrease in the number of active drilling rigs in the United States. However, in any case, this support will be very short-term and limited.

The downward trend prevails, pushing the price towards the December low of $50.00 per barrel. Only growth into the zone above the resistance levels of 62.50 (EMA200 on the daily chart), 63.90 (Fibonacci level 38.2%) will again make long-term long positions relevant.

A signal to start shopping can be a breakdown of the resistance levels 56.20 (EMA200 on the 1-hour chart) and 56.90 (Fibonacci level 50% of downward correction in the wave of price growth from the level near the level of 27.10 to the highs of October 2018 near the level of 86.60 dollars per barrel). Short positions are preferred so far.

Support Levels: 52.00, 51.00, 50.00

Resistance Levels: 53.50, 56.20, 56.90, 58.60, 60.40, 61.80, 62.50, 63.90


Trading recommendations


Sell by market. Stop-Loss 54.10. Take-Profit 52.00, 51.00, 50.00

Buy Stop 54.10. Stop-Loss 52.10. Take-Profit 56.20, 56.90, 58.60, 60.40, 61.80, 62.50, 63.90

270220-Brent-W.png


270220-Brent.png


*) For up-to-date and detailed analytics and news on the forex market visit Tifia Forex Broker website tifia.com
 
S&P500: negative dynamics

28/02/2020


World and US stock indices continued to decline in the first half of today's trading day.

Last Thursday, the Dow Jones Industrial Average fell another 4.4% to 25766.00 points, the S&P 500 fell 4.4% to 2978.00 points, and the Nasdaq Composite fell 4.6% to 8566.00 points. All three indices fell more than 10% from their recent highs reached this month, moving to the territory of correction.

Due to the global spread of coronavirus, investors avoid risky assets and prefer protective assets such as government bonds and gold.

According to the latest data, the number of people infected with coronavirus worldwide exceeded 82,000, and the death toll was 2,800.

Pessimism of investors is dominant in financial markets, associated with expectations of a slowdown in the global economy due to coronavirus. At the beginning of the European session on Friday, the yield on 10-year US government bonds fell to 1.163% (against 1.505% at the end of last month), which corresponds to absolute record lows.

S&P500 has lost by now more than 15%, having dropped from absolute highs, where it was still 2 weeks ago.

The index broke through the most important long-term support levels 3080.0 (ЕМА200 on the daily chart), 2990.0 (Fibonacci level 38.2% of the correction to the growth since December 2018 and the level of 2335.0) and continued to decline in the first half of today's trading day. In case of further decline, the targets will be the support levels of 2865.0 (Fibonacci level 50%), 2740.0 (Fibonacci level 61.8%), 2700.0 (ЕМА200 on the weekly chart).

The first signal for purchases may be a breakdown of the resistance levels of 2990.0 (Fibonacci level 38.2%), 3025.0 (highs of July 2019), and after the S&P500 returns to the zone above the resistance levels of 3080.0, 3147.0 (Fibonacci level 23.6%), the index will continue to grow , and the long-term bull trend will resume.

Support Levels: 2865.0, 2740.0, 2700.0

Resistance Levels: 2990.0, 3025.0, 3080.0, 3147.0


Trading Recommendations


Sell Stop 2875.0. Stop-Loss 2995.0. Objectives 2865.0, 2740.0, 2700.0

Buy Stop 2995.0. Stop-Loss 2875.0. Objectives 3025.0, 3080.0, 3147.0, 3200.0, 3400.0, 3450.0, 3490.0

280220-s500-W.png


280220-s500-D.png


*) For up-to-date and detailed analytics and news on the forex market visit Tifia Forex Broker website tifia.com
 
AUD/USD: commodity currencies strengthened on Monday

02/03/2020


During the Asian session on Monday, the AUD / USD pair rose by 1.3% to 0.6550, which is 115 points higher than the minimum reached last Friday.

Some economists and investors are beginning to gradually realize that fears of a global coronavirus pandemic and a fall in global stock indices have turned out to be excessive.

Moreover, some leaders of global central banks have made it clear that central banks will support the economy if necessary.

Jerome Powell, chairman of the US Federal Reserve, made it clear on Friday that the central bank is preparing to lower interest rates to support the economy in light of the spread of coronavirus.

On Monday, Bank of Japan Governor Haruhiko Kuroda said the central bank is closely monitoring the development of the situation around the coronavirus and "will be able to provide enough liquidity, as well as ensure the stability of financial markets through market operations and asset acquisitions".

Market participants will be waiting for the results of the meetings of the central banks of Australia and Canada, which will be held this week. Some investors and economists expect the RBA to cut rates by 25 basis points on Tuesday, and then continue to cut rates in April.

If the RBA takes this step, then other major central banks may follow suit. The decision on the RBA interest rate will be published on Tuesday at 03:30 (GMT).

On Monday, AUD / USD is growing, trying to develop a correction into the zone above the short-term resistance level of 0.6587 (ЕМА200 on the 1-hour chart).

In case of its breakdown, correctional growth will continue to resistance levels of 0.6670, 0.6700 (ЕМА200 on the 4-hour chart).

A signal for the resumption of decline may be a breakdown of the short-term support level of 0.6535 (EMA200 on the 15-minute chart).

Below the key resistance level of 0.6850 (ЕМА200 on the daily chart), the downward global trend of AUD / USD prevails.

Support Levels: 0.6535, 0.6500, 0.6434, 0.6400, 0.6300

Resistance Levels: 0.6587, 0.6670, 0.6700, 0.6755, 0.6810, 0.6850


Trading Recommendations


Sell Stop 0.6530. Stop-Loss 0.6590. Take-Profit 0.6500, 0.6434, 0.6400, 0.6300

Buy Stop 0.6590. Stop-Loss 0.6530. Take-Profit 0.6670, 0.6700, 0.6755, 0.6810, 0.6850

020320-AU-D.png


020320-AU-H1.png


*) For up-to-date and detailed analytics and news on the forex market visit Tifia Forex Broker website tifia.com
 
USD/CAD: global central banks will support the economy

03/03/2020


Back in January, the USD / CAD was traded near the multi-month low of 1.2960, which corresponds to the levels of October 2018. However, already at the end of February, USD / CAD reached 1.3460 (June 2019 levels), gaining 4.3% in two months.

Fears about the coronavirus pandemic caused a severe drop in world stock indices and commodity prices, with which crawled down and commodity currencies quotes.

In its latest report, released on Monday, the Organization for Economic Co-operation and Development (OECD) lowered its forecast for economic growth in 2020, as China's economy was hit hard by the outbreak of coronavirus. Now the OECD expects that global GDP this year will grow by 2.4% compared to 2.9% according to the December forecast.

Investors now hope that global central banks and government departments will help markets stabilize and protect the economy from the effects of coronavirus.

The RB of Australia lowered its interest rate by 0.25% on Tuesday, bringing it to the level of 0.50%, which was the fourth decrease in less than a year. RBA Governor Philip Lowe signaled the likelihood of further policy easing.

On Wednesday, a meeting of the Bank of Canada will take place, and the decision on the rate will be published at 15:00 (GMT).

If the Bank of Canada reduces the rate by 0.25%, then it will drop to 1.50% from the current 1.75%.

Signs of worsening morbidity in Iran, Italy and South Korea are forcing market participants and global central banks and governments to overestimate the severity of impending problems. The decline in world commodity prices, primarily oil, is also putting pressure on the Canadian dollar. Thus, the USD / CAD pair is likely to maintain positive momentum, at least this week.

Above the short-term support level of 1.3330 (ЕМА200 on the 1-hour chart), only long positions should be considered. A signal for sales may be a breakdown of this support level with a target at support levels 1.3253 (ЕМА200 on the 4-hour chart), 1.3215 (ЕМА200 on the daily chart). Above the support level of 1.3215, the bullish trend of USD / CAD prevails.

Support Levels: 1.3345, 1.3330, 1.3253, 1.3215

Resistance Levels: 1.3380, 1.3435, 1.3452, 1.3465


Trading Scenarios


Sell Stop 1.3310. Stop-Loss 1.3410. Take-Profit 1.3253, 1.3215

Buy in the market. Stop-Loss 1.3310. Take-Profit 1.3380, 1.3435, 1.3452, 1.3465

030320-UCD-D.png


030320-UCD-H1.png


*) For up-to-date and detailed analytics and news on the forex market visit Tifia Forex Broker website tifia.com
 
NZD/USD: emergency measures

04/03/2020


As a result of an almost recoilless decline over the past 2 months, the NZD / USD pair reached a local minimum near the 0.6190 mark in early March, which corresponds to the lows of July 2009, when the global crisis of 2008 only began to decline.

However, in early March, the decline in NZD / USD stopped, and in the last 3 days the pair rose sharply, reaching 0.6300 at the beginning of today's European session.

On Tuesday, representatives of the G7 promised to use all the necessary tools to protect their economies from the risks associated with the outbreak of coronavirus, and the Fed unexpectedly lowered the interest rate by 0.50%. “The fundamental economic indicators of the United States remain strong. Nevertheless, coronavirus poses a growing risk for economic activity”, the central bank said. “The Committee (the Federal Reserve for Open Market Operations) is closely monitoring developments and their potential impact on economic prospects. intending to use their tools and act accordingly to support the economy".

In March, the Fed, the ECB, the Bank of Japan, the Bank of England, the National Bank of Switzerland, and the RB of New Zealand will hold their next meetings on monetary policy, and today the Bank of Canada will decide on the rates.

He will probably also follow the example of the Fed and lower the interest rate. A meeting of the Reserve Bank of New Zealand is scheduled for March 25. The bank is likely to lower its key interest rate, and it is possible to lower it by 0.50%. However, a more significant role in the dynamics of NZD will be played by the state of world stock markets.

If the growth of stock indices continues, then, accordingly, commodity currencies, in particular, NZD, will continue to strengthen.

OsMA and Stochastic indicators on the 1-hour, 4-hour, daily charts of the pair NZD / USD turned to long positions. In case of continued growth of NZD / USD, the target will be the resistance level of 0.6500 (EMA200 on the daily chart).

Below this level of resistance, negative long-term dynamics still prevail, and a return to the zone below the level of 0.6300 (EMA200 on the 1-hour chart) will cause a resumption of the decline in NZD / USD.

In this case, the targets will be the support levels of 0.6260 (September 2015 lows and the Fibonacci level 0% of the correction in the global wave of pair decline from the level of 0.8820), 0.6205 (September lows), 0.6190 (local multi-year lows).

Support Levels: 0.6260, 0.6200, 0.6100

Resistance Levels: 0.6300, 0.6322, 0.6378, 0.6406, 0.6485, 0.6505, 0.6600, 0.6635, 0.6665, 0.6740, 0.6830, 0.6865


Trading Scenarios


Sell Stop 0.6290. Stop-Loss 0.6325. Take-Profit 0.6260, 0.6200, 0.6100

Buy Stop 0.6325. Stop-Loss 0.6290. Take-Profit 0.6378, 0.6406, 0.6485, 0.6505, 0.6600, 0.6635, 0.6665, 0.6740, 0.6830, 0.6865

040320-NU-H1.png


D-040320-NU.png


*) For up-to-date and detailed analytics and news on the forex market visit Tifia Forex Broker website tifia.com
 
Brent: prices remain vulnerable

05/03/2020


The price of oil continues to decline. It is likely that until a final turning point in the global stock market occurs, commodity prices, including oil, will remain under pressure with a tendency to further decline.

Today, oil market participants will be waiting for the first results of the OPEC+ coalition meeting. The positive outcome of the meeting may be the first step towards the restoration of the oil market.

At the same time, lower interest rates by global central banks can help the global economy deal with the impact of a coronavirus outbreak. This will also positively affect oil quotes.

Investors expect the OPEC+ coalition to further reduce production to stabilize the oil market. At the same time, the exact amount of a possible additional decline in production, which is 1.7 million barrels per day, is not yet clear.

If the parties cannot agree on significant volumes of production cuts, then the positive effect of the meeting in Vienna will be short-lived.

In case of breakdown of the support level of 50.00 (Fibonacci level 61.8% of downward correction in the wave of price growth from a level near the level of 27.10 to the highs of October 2018 near the level of 86.60 dollars per barrel), the nearest targets will be support levels of 49.00 (local minimum), 48.00 (lower downward channel border on the daily chart).

Only a breakdown of the key resistance level of 62.00 (EMA200 on the daily chart) will again make long positions relevant. Below this resistance level, long-term negative dynamics prevail.

Support Levels: 50.00, 49.00, 48.00

Resistance Levels: 53.50, 54.30, 56.90, 58.50, 60.40, 62.00


Trading Recommendations


Sell by market. Stop-Loss 54.40. Take-Profit 50.00, 49.00, 48.00

Buy Stop 54.40. Stop-Loss 51.90. Take-Profit 56.20, 56.90, 58.50, 60.40, 61.80

050320-Brent-H1.png


D-050320-Brent.png


*) For up-to-date and detailed analytics and news on the forex market visit Tifia Forex Broker website tifia.com
 
EUR/USD: panic?

06/03/2020


Increased fears of a coronavirus pandemic plummeted global stocks at the start of today's European session. The DXY dollar index fell below 96.00, and the yield on 10-year US bonds fell by almost 18%, to 0.723%, to historical lows.

The growth of almost panic investor sentiment was facilitated by information on the penetration of coronavirus into the United States. EUR / USD updated the highs of July 2019, breaking through the psychologically significant resistance level of 1.1300, and reached the first critical resistance level of 1.1340 at the beginning of today's European session (EMA144 on the weekly chart). If the growth of EUR / USD does not stop, then the pair can reach the key resistance level of 1.1440 (EMA200 on the weekly chart), the breakdown of which can signal the breaking of the long-term bearish trend of EUR / USD.

Last Tuesday, the Fed unexpectedly lowered the interest rate by 0.50%, substantiating its decision with the need for preventive measures to maintain the American economy, which, according to Fed leaders, remains strong. The next Fed meeting will be held on March 18, and it is possible that the rate will be reduced again. By the way, US President Donald Trump after the Fed lowered the rate on Tuesday again called on the Fed to lower the interest rate even lower, down to 0%. “They (the Fed) are acting belatedly”, Trump said, but should, in his opinion, act ahead of events.

Today, volatility in the financial markets may rise again at 13:30 (GMT), when data from the US labor market will be published. Strong data expected.

Nevertheless, even if the data are confirmed or turn out to be better than expected (NFP is expected to grow by 175,000 new jobs), one should not expect a significant strengthening of the dollar and a fall in EUR / USD.

The fall of European stock indices leaves the euro, which is the funding currency, no chance of weakening.

In the current situation of growth of already almost panic moods, it makes no sense to expect a quick recovery of world stock indices. Technical analysis fades into the background.

And, nevertheless, you can’t completely forget about the alternative scenario. The first signal to start the correctional decline will be the breakdown of support levels 1.1285 (Fibonacci level 23.6% of upward correction to the fall of the pair from 1.3870 in May 2014 to 1.0480 reached in March 2015), 1.1240 (ЕМА200 on the 5-minute price chart and highs of December 2019).

However, only the return of EUR / USD to the zone below the key support level of 1.1100 (EMA200 on the daily chart) will reassure investors and create the prerequisites for the pair to sell.

Support Levels: 1.1300, 1.1285, 1.1240, 1.1205, 1.1100

Resistance Levels: 1.1340, 1.1400, 1.1440


Trading Recommendations


Sell Stop 1.1275. Stop-Loss 1.1330. Take-Profit 1.1240, 1.1205, 1.1100

Buy Stop 1.1330. Stop-Loss 1.1275. Take-Profit 1.1340, 1.1400, 1.1440

D-060320-EU-D.png


W-060320-EU-W.png


060320-10-Y.png


*) For up-to-date and detailed analytics and news on the forex market visit Tifia Forex Broker website tifia.com
 
Back
Top