Solid ECN | Daily Technical | Video | Major Products

usdjpy-forum-1.png


Consolidation near record highs
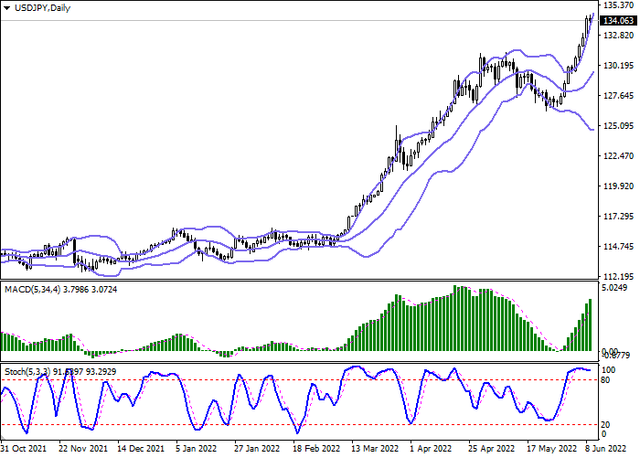
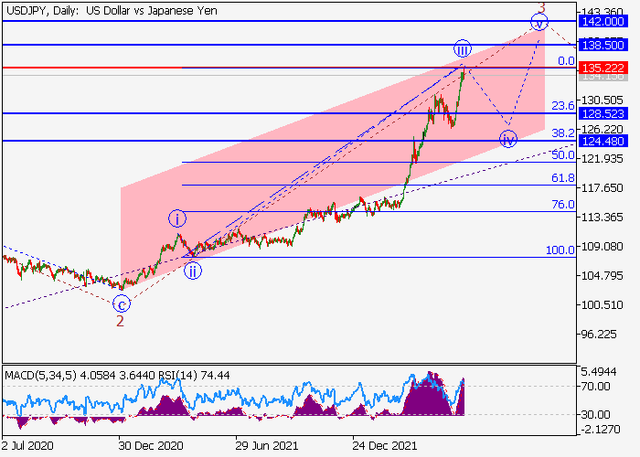
The US dollar shows mixed trading dynamics, consolidating near new record highs and the level of 134 and continuing the development of the general uptrend since May 30.

The pressure on the positions of the yen is exerted by the prospect of maintaining the current soft monetary policy of the Bank of Japan. While virtually all major financial regulators have moved on to sharply raise interest rates (the European Central Bank (ECB) is expected to launch the program in July), the Japanese authorities are pushing for continued stimulus. Such statements were made by the Deputy Governor of the regulator Masazumi Wakatabe, who also admitted the possibility of introducing new incentives if the economic situation so requires.

Macroeconomic statistics released yesterday in Japan did not provide any noticeable support to the yen. Revised data on the dynamics of gross domestic product for Q1 2022 were revised upward from –0.2% to –0.1% in quarterly terms and from –1.0% to –0.5% in annual terms, and the Eco Watchers Survey on Current Situation in May rose from 50.4 to 54.0 points, while the forecast was for a decline to 49.2 points.

Meanwhile, the Japanese authorities announced the continuation of work in the Russian oil and gas projects Sakhalin-1 and Sakhalin-2. The decision is contained in the national Energy White Paper. It is emphasized that in the current high energy prices, the country needs stable supplies of liquefied gas, and long-term contracts can reduce the negative effect on energy security. Mitsui & Co., Ltd. and Mitsubishi Corp. own 12.5% and 10% shares of the Sakhalin-2 project, and most of the gas produced here is supplied to Japan.

usdjpy-1.png


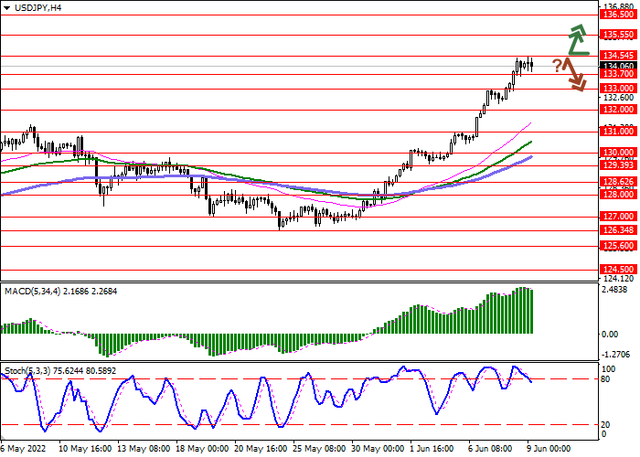
Bollinger Bands in D1 chart show quite active growth. The price range is expanding, but still does not keep pace with the development of "bullish" sentiment in the market. MACD grows, preserving a stable buy signal (located above the signal line). Stochastic has been near its highs for a long time, indicating high risks of the US dollar being overbought in the ultra-short term.

Resistance levels: 134.54, 135.55, 136 | Support levels: 133.7, 133, 132, 131

usdjpy-2.png
 
eurusd-forum-1.png


Correction ahead of the ECB meeting
The European currency continues the local upward movement, which began yesterday after the publication of positive data on the state of the EU economy. Now the EURUSD pair is holding around the 1.0700 mark.

Thus, the gross domestic product for the first quarter increased by 0.6%, ahead of analysts' forecasts of 0.3% and the previous value of 0.2%. Thus, the growth was 5.4% YoY compared to 4.7% in the previous period. Today, investors will follow the course of the meeting of the European Central Bank (ECB). Traders expect to hear specific dates for the start of tightening monetary policy, as recently, the head of the department, Christine Lagarde, has already stated the need to raise rates and curtail the asset purchase program. Analysts believe that if the increase occurs, then not today since the ECB is not yet ready for "hawkish" steps.

eurusd.png


The instrument moves within a wide downwards channel, approaching the resistance line. Technical indicators maintain a stable buy signal: fast EMAs on the Alligator indicator are above the signal line, and the AO oscillator histogram forms upward bars.

Resistance levels: 1.0778, 1.1131 | Support levels: 1.0630, 1.0351​
 
usdcad-forum-1.png


The market is waiting for the US inflation data
USDCAD is correcting upwards, trading around 1.269. The Canadian currency has been actively increasing in value against the US dollar for almost the entire week; however, in the end, it lost all the gained positions, which was caused by two main factors.

First of all, the Bank of Canada released a report on financial stability, which reflected the main points of vulnerability of the national economic system. The regulator noted the negative dynamics of housing prices, which have grown by more than 50% since the beginning of the coronavirus pandemic and until now. In addition, the country has recorded an increase in the number of heavily indebted households, which in the near future may face an even greater burden due to rising interest rates on loans.

The second reason for the growth of USDCAD is the strengthening of the US dollar, which reached 103 in the USD Index. In turn, market participants almost did not react to another increase in the number of Initial Jobless Claims, which amounted to 229K against 202K a week earlier. Key expectations of investors are related to today's data on consumer inflation in the US, which may increase by 0.7% over the month and remain at 8.3% in annual terms.

uscad.png


On the global chart of the asset, the price continues to trade within a wide ascending channel with dynamic boundaries of 1.2450–1.3100, having reached the support line the day before. The fluctuation range of the Alligator indicator EMAs began to actively narrow, and the histogram of the AO oscillator is forming new ascending bars, actively rising in the sell zone.

Support levels: 1.2630, 1.2463 | Resistance levels: 1.2730, 1.2890​
 
mcdonald-forum-1.png


ECB expects high inflation to continue
The European currency reversed and continued to decline after the European Central Bank published its decision on monetary policy. Thus, the interest rate was kept at 0.00%, and the Board of Governors announced the end of the Asset Purchase Program (APP) from July 1, 2022, to make it possible to increase the key rate by 25 basis points already at the July meeting. The regulator will not change the existing values for margin credit and deposit lines, leaving them around 0.25% and -0.50%, respectively. However, European officials do not rule out another increase in September, which will depend entirely on the inflation rate, which, according to forecasts, will remain high for a long time. According to forecasts, the consumer price index will be at 6.8% during 2022, and only in the middle of 2023 is it possible to adjust to 3.5% and 2.1% in 2024. The dynamics of the gross domestic product will also slow down – from 3.7% to 2.8%.

mcdonald.png


The asset moves within a wide downward channel, approaching the resistance line. Technical indicators have sharply changed their readings and are turning in the direction of selling: fast EMAs on the Alligator indicator are actively approaching the signal line, and the AO oscillator histogram has formed the first downward bar.

Resistance levels: 1.0774, 1.1075 | Support levels: 1.0547, 1.0351​
 
eurusd-forum-1.png


ECB expects high inflation to continue
The European currency reversed and continued to decline after the European Central Bank published its decision on monetary policy. Thus, the interest rate was kept at 0.00%, and the Board of Governors announced the end of the Asset Purchase Program (APP) from July 1, 2022, to make it possible to increase the key rate by 25 basis points already at the July meeting. The regulator will not change the existing values for margin credit and deposit lines, leaving them around 0.25% and -0.50%, respectively. However, European officials do not rule out another increase in September, which will depend entirely on the inflation rate, which, according to forecasts, will remain high for a long time. According to forecasts, the consumer price index will be at 6.8% during 2022, and only in the middle of 2023 is it possible to adjust to 3.5% and 2.1% in 2024. The dynamics of the gross domestic product will also slow down – from 3.7% to 2.8%.

eurusd.png


The asset moves within a wide downward channel, approaching the resistance line. Technical indicators have sharply changed their readings and are turning in the direction of selling: fast EMAs on the Alligator indicator are actively approaching the signal line, and the AO oscillator histogram has formed the first downward bar.

Resistance levels: 1.0774, 1.1075 | Support levels: 1.0547, 1.0351​
 
nzdusd-forum-1.png


The New Zealand currency is declining against the US dollar. However, there is an obvious trend towards its strengthening relative to other currencies due to the publication of positive national macroeconomic statistics: after the removal of the main coronavirus restrictions, the flow of people crossing the border increased significantly, reaching 266.7K people in April, which significantly exceeds the figures of previous months and 15.9K in May 2020. Also, data on spending on credit cards were published earlier, which reflected an increase in the purchasing activity of the population. Thus, the May figure was 123M New Zealand dollars, which is 1.4% higher than the April data.

The US currency strengthened significantly, surpassing 104.000 in the USD Index. The upward trend was catalyzed by the publication of data on consumer prices: inflation in the United States increased to 8.6% compared to May 2021, which exceeded the analysts' forecast, which assumed that the indicator would remain at 8.3%. The US Federal Reserve did not expect the index to rise in May, but it amounted to 1.0%, significantly exceeding the consensus forecast of 0.7%, leading to an annual value increase. Such statistics mean that the US regulator will have to continue actively tightening monetary policy.

nzdusd.png


The trading instrument is moving within the global downtrend, approaching the year's low around 0.6220. Technical indicators reversed and gave a sell signal: fast EMAs on the Alligator indicator crossed the signal line downwards, and the AO oscillator histogram formed new downward bars below the zero line.

Resistance levels: 0.6410, 0.6566 | Support levels: 0.6220, 0.6070​
 
usdjpy-forum-1.png


On the daily chart, the first wave of the higher level (1) develops, within which the wave 3 of (1) forms. Now, the third wave of the lower level iii of 3 has developed, within which the wave (v) of iii has formed, and a downward correction has started to develop as the fourth wave iv of 3.

If the assumption is correct, the USD JPY pair will fall to the levels of 128.52 – 124.48. In this scenario, critical stop loss level is 135.22.

usdjpy.png
 
gbpusd-forum-2.png


The pound is correcting after yesterday's negative dynamics caused by the publication of disappointing macroeconomic data, and now the GBP USD pair is trading around the level of 1.2172.

According to data for April, the UK economy slowed down by 0.3%, which led to a decrease in the growth rate to 0.2% QoQ. The negative dynamics harmed the annual GDP, which fell to 3.4% YoY from 6.4% earlier. Despite the upward correction, today's macroeconomic data did not reassure investors: the unemployment rate rose to 3.8% from 3.7% in March, and the Claimant Count Change decreased by only 19.7K instead of the expected 49 .4K against the background of correction of the average level of wages to 6.8% from 7.0% a month earlier.

gbpusd.png


Yesterday, the instrument renewed the year's low at 1.2170 and is now trying to consolidate below it. The technical indicators reversed rather quickly and gave a new sell signal: indicator Alligator's EMA oscillation range expands downwards, and the histogram of the AO oscillator forms downward bars.

Resistance levels: 1.2317, 1.2629 | Support levels: 1.2107, 1.1952​
 
usdcad-forum-1.png


Yesterday, Statistics Canada (StatCan) published data on the state of the Construction Sector, investment in which has been increasing for the seventh month in a row, adding 2.7% to 20.0 billion Canadian dollars in April. Financing for the construction of houses increased by 3.2%, and for the construction of non-residential buildings it increased by 1.4%. These data point to the stability of the real estate market in Canada, even in conditions of high inflation. Today, traders will be watching the data on Manufacturing Sales, which is expected to slow down to 1.6% from 2.5% a month earlier.

The US dollar, in turn, reached an all-time high of the year on May 12 at 104.900 in the USD Index on the back of a wave of sell-offs in risky assets, remaining stable in anticipation of today's publication of Producer Price Index data. According to forecasts, the May Producer Price Index may rise by 0.8%, which will provide an uptrend in the annual rate by 10.9%, and this, in turn, will signal a strengthening of the national currency.

usdcad.png


On the global chart of the asset, the price is trading within the wide upward channel with dynamic borders of 1.2450–1.3100, actively approaching the resistance line. The fluctuation range of the Alligator indicator EMAs is about to issue a buy signal, and the histogram of the AO oscillator is forming new ascending bars, actively rising in the sell zone.

Support levels: 1.2763, 1.2525 | Resistance levels: 1.2937, 1.3077​
 
true-ecn-broker-1.png


USD TRY, Turkish statistics alarm investors
According to the Turkish Statistical Institute (TurkStat), Retail Sales added 14.7% in April 2022, supported by a 31.3% increase in sales of non-food products, while the same indicator for fuel and food corrected down by 2.8% and 1.1% respectively. Despite the positive results, the Inflation Research Group (ENAG), created by Turkish scientists and economists, seriously doubted their reliability. According to experts, the agency deliberately understates data on consumer price dynamics, and the May figure was not 73.50%, as stated in official statistics, but 161.0%. Against this background, the Turkish government is considering the possibility of banning independent economic analysts from publishing statistics without prior approval from TurkStat.

In turn, the US currency reached 105 in the USD Index and consolidated there, in anticipation of the evening publication of the US Federal Reserve's decision on the interest rate, which can be increased once again by at least 50 basis points. There is practically no doubt about the correction of the value, and the implementation of the forecast will only increase the upward momentum in the trading instrument.


The USD TRY quotes are rising as part of another wave of global growth, approaching the all-time high of 2021 at around 18.25. Technical indicators maintain a steady buy signal: the range of EMA fluctuations on the Alligator indicator is still directed upwards and the AO oscillator histogram is trading in the purchases area, forming new ascending bars.

Support levels: 16.9, 16.15 | Resistance levels: 17.5, 18.25​

Read more market news
 
Back
Top