Solid ECN | Daily Technical | Video | Major Products

true-ecn-broker-1.png


USD JPY, the market is waiting for decisive steps from the Bank of Japan
The USD JPY pair shows extremely unstable trading dynamics as investors are waiting for a two-day meeting of the Bank of Japan on monetary policy, being corrected around 134.36.

The yen is rapidly declining amid ultra-soft policy from the country's main financial regulator, and inflation in May rose sharply to 2.5% from 1.2%, which requires the authorities to take steps to contain it. As for the local macroeconomic background, foreign trade data were published today, among which the increase in imports by 48.9% in May is particularly notable, which led to a serious correction in the trade balance to –2.384T yen from –842.8B for the month previously.

The American currency unexpectedly for investors remained at the beginning of the week at 105 in the USD Index after the decision of the US Federal Reserve to raise the rate by 75 basis points to 1.75%. Also, the regulator plans to increase the pace of treasury and mortgage securities sales from September to 60B and 35B dollars, respectively, from the current 30B and 17.5B dollars. By the end of the year, the agency expects that the rate will reach 3.4%, and in 2023, the rate of increase will be reduced, and the indicator will stop around 3.8%, after which it is planned to start a cycle of reduction in 2024 and bring the value to 3.4%.

usdjpy.png


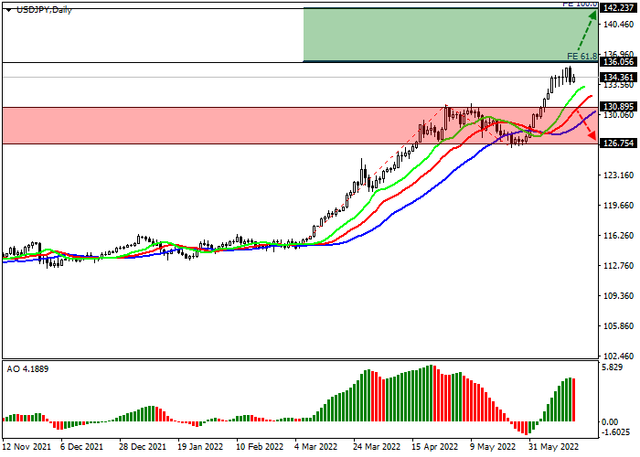
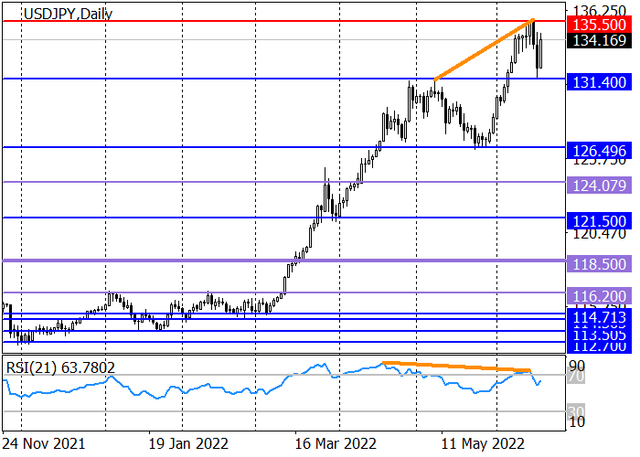
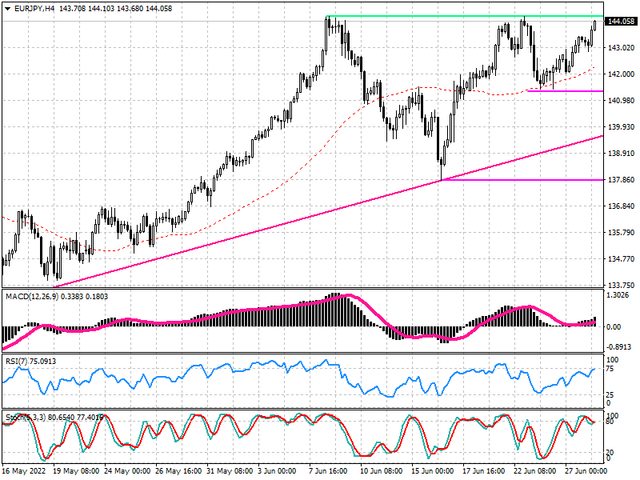
The instrument is moving within the global uptrend, having renewed another high of the year at 135.5 yesterday. Technical indicators maintain a stable buy signal: indicator Alligator's EMA oscillation range expands upwards, and the histogram of the AO oscillator forms new rising bars.

Resistance levels: 136, 142.2 | Support levels: 130.9, 126.75

Read more market news
 
5.png


EUR USD, investors expect inflation data in the EU
The European currency is trading with a slight slowdown after yesterday's strong growth, caused by investors' reaction to the wage increase in the EU in the first quarter by 2.70% from 1.50%, but today's data will have a key impact on the dynamics of the instrument. In the middle of the day, Eurostat will publish May's CPI, which estimates inflation, and the monthly increase could be 0.8% against the 0.6% shown in April, and the growth will remain around 8.1% YoY. As for the core consumer price index, which does not consider food and fuel prices, analysts do not expect positive dynamics and expect the value to remain at the April level of 3.8%.

After three days of being near the year's highs, around 105.000 in the USD Index, Quotes of the American currency reversed downwards and rolled back to 104.000 against the backdrop of disappointing data on the US labor market. Initial Jobless Claims amounted to 229K, which exceeds the quoted market expectations of 215K, and the total number of citizens receiving payments from the state consolidated at 1.312M compared to 1.309M last week. Investors drew attention to a significant decrease in the index of manufacturing activity from the Philadelphia Fed in June to –3.3 points from 2.6 points in May.

eurusd.png


The trading instrument moves within a narrow downward channel, approaching the support line. Technical indicators maintain a global sell signal: indicator Alligator's EMA oscillation range downwards, and the AO oscillator histogram has formed another down bar in the sell zone.

Resistance levels: 1.0630, 1.0778 | Support levels: 1.0377, 1.0151​

Read more market news
 
5.png


AUD USD, the uptrend is possible
AUD USD continues its uncertain corrective dynamics, trading at 0.6997 after the Australian Bureau of Statistics (ABS) published labor market data in May. According to the report, the Unemployment Rate remained at 3.9% for the third consecutive month, signaling a slowdown in labor force growth. Despite this, Employment Change in the country increased by 60.6K to 13.510M people, and the Participation Rate grew to 66.7%, although the Unemployment Change increased by 7.8K people, amounting to 548.1K. Thus, the national labor market is actively recovering, which provides support to the national economy.

In turn, two key blocks of statistics were published yesterday in the US, which influenced the quotes. Initial Jobless Claims amounted to 229K, which exceeded the 215K projected by analysts, and Continuing Jobless Claims increased to 1.312M from 1.309M. In addition, a report on the state of the housing market was released, according to which in May the Building Permits Change fell to 1.695M from 1.823M a month earlier, which led to a decrease in the Housing Starts to 1.549M from 1.810M a month earlier.
audusd.png


On the global chart of the asset, the price is trading within the Expanding Formation pattern, making a second attempt to implement the 5th wave. Technical indicators have already begun to weaken the sell signal: the fast EMAs of the Alligator indicator are approaching the signal line and the histogram of the AO oscillator has almost reached the transition level.

Support levels: 0.6966, 0.6850 | Resistance levels: 0.7072, 0.7265

Read more market news
 
5.png


USD JPY, development of a new upward momentum
After a correction to 131.40, the pair USD JPY starts a new upward momentum with the target at 135.50 amid investor disappointment in the policy of the Bank of Japan. Today the regulator decided to leave the interest rate unchanged at –0.10%. At a subsequent press conference, department head Haruhiko Kuroda said it was appropriate now to maintain the current strong monetary easing to support the economy, which is needed for profitable companies to benefit from the poor yen and get a boost in capital expenditures, higher wages and a strengthening trend from income to expenses. It, in turn, should boost inflation to the 2.00% target. The Bank of Japan will continue to closely monitor the impact of the yen on the economy and prices and, in the event of a sharp change in the situation, will be ready to respond accordingly.

The Japanese authorities intend to create a specialized headquarters, the main task of which will be to monitor the market and combat the rise in the cost of living of the population and rising inflation in the country against the backdrop of rising energy costs and the weakening yen. Hirokazu Matsuno, Secretary General of the Cabinet of Ministers of Japan, noted that experts would also assess the impact of tightening the American regulator's monetary policy parameters and, in particular, the increase in the interest rate to 1.75% on the national economy. It is noted that the anti-crisis body will begin work on June 21.

usdjpy-1.png


It is likely that in the long term, the growth of the USD JPY pair will continue to 139 and 141 since, from a fundamental point of view, the US dollar will strengthen due to the tightening of the monetary policy of the US Federal Reserve and the increase in interest rates.

The long-term trend is upward. After the test of key support around 131, a new impulse began, which was to renew the weekly high around 135.5. In case of breakdown, the positive dynamics will continue to 139. According to the RSI indicator, there is a divergence on the chart, leading to a technical correction in the medium term.

The medium-term trend is upwards. This week, the traders tested the key trend support 131.63–131.29, after which the price began to rise to the high of the week in the 135.50 area, and zone 3 (137.10–136.72) will become its next target.

Resistance levels: 135.50, 139, 141 | Support levels: 131.40, 126.50, 124.08

usdjpy-2.png
 
5.png


AUD USD - Technical analysis

H4

On the four-hour chart above the level of 0.6901 there is a "bullish" Engulfing Pattern, which signals a price reversal at the bottom, as well as a Bullish Belt Hold pattern, explaining that the buyers attempted to counterattack, but the "bears" seized the initiative, which became a driver for the decline in instrument quotes. At the moment, the most likely scenario is with an uptrend from the support level of 0.6841 to the resistance area of 0.7048, overcoming which will allow the "bulls" to move higher into the range of 0.7270–0.7581. An alternative scenario may be relevant if the buyers fail to hold the support level of 0.6841: then the price may fall down to the level of 0.6539.

audusd-1.png


D1
On the daily chart, there is a formation of a Double Bottom price pattern. An additional signal for a reversal may be the formation of a large Bullish Candle above the support level of 0.6841, which is also a Bullish Belt Hold pattern. Next is the formation of another Bullish Belt Hold pattern, which is similar to the Piercing Pattern of the reversal at the bottom. In the current situation, it is possible to retest the level of 0.6841, from where the instrument may bounce to the resistance level of 0.7048, with its subsequent overcoming and the price recovering to the zone of 0.7270–0.7581.

audusd-2.png


Support levels: 0.6841, 0.6693, 0.6539 | Resistance levels: 0.7048, 0.7270, 0.7581​
 
5.png


NZD USD - New Zealand dollar remains under pressure
The New Zealand dollar is actively falling during morning trading, testing the level of 0.6265 for a breakdown. NZD USD is updating local lows from June 16, reacting to the recovery in demand for the "safe" US dollar, as well as to the aggravation of the geopolitical situation after the Lithuanian authorities announced restrictions on the transit of Russian goods to the territory of Kaliningrad.

Additional pressure on the positions of the trading instrument was exerted by rather weak macroeconomic statistics from New Zealand. Westpac Consumer Survey in Q2 2022 fell from 92.1 to 78.7 points, while analysts expected it to rise to 100 points. Global Dairy Trade index declined 1.3% after gaining 1.5% in the prior period, with only a 0.1% downward correction forecast. The volume of Exports from New Zealand in May rose from 6.16 billion to 6.95 billion dollars; however, against the backdrop of an increase in imports from 5.72 billion to 6.69 billion dollars, the trade deficit in May only increased from –9.29 billion to –9.52 billion dollars.

nzdusd.png


Resistance levels: 0.63, 0.635, 0.64, 0.645 | Support levels: 0.6244, 0.62, 0.6156, 0.61​
 
5.png


AUD USD - the instrument is consolidating around 0.69
The Australian dollar shows corrective growth, winning back the losses of the previous two "bearish" sessions. The instrument is again testing the level of 0.6900 for a breakout, receiving support from the growth of corrective moods in the US currency. Investors are in a hurry to fix their profits, and also react to the publication of rather weak macroeconomic statistics from the US.

The data released the day before by S&P Global pointed to a drop in the index of business activity in the US Services sector from 53.4 to 51.6 points, while analysts had expected growth to 53.5 points. The Manufacturing PMI fell sharply from 57.0 to 52.4 points, which also turned out to be significantly worse than the market's expectations of a reduction to 56.0 points. The Composite PMI in June corrected from 53.6 to 51.2 points, while the forecast was at the level of 53.7 points.

Additional pressure on the markets yesterday was exerted by the speech of US Federal Reserve Chairman Jerome Powell in the US Senate, where the official again noted significant risks of expanding inflationary pressure within the country, recognizing the possibility of a recession due to the regulator's "hawkish" position. At the same time, the Fed intends to further tighten monetary policy, trying to return the Consumer Price Index to the target level of 2%.

audusd.png


In Australia, against the background of a lack of energy obtained with the help of solar panels and wind generators, a fuel crisis is rapidly developing. Last week, the Australian Energy Market Operator (AEMO) announced it was suspending market and capping wholesale electricity prices until June 23 due to the impossibility of uninterrupted supplies to consumers. Due to the existing deficit, local companies had to buy oil and gas in the spot markets, which contributed to a sharp increase in costs. The government is ready to return to coal-fired infrastructure, as Australian Resources Minister Madeleine King said earlier, noting that the resumption of such enterprises will provide an additional 30% of energy capacity and improve the situation with the energy supply on the east coast.

Resistance levels: 0.695, 0.7, 0.705, 0.71 | Support levels: 0.69, 0.6849, 0.68, 0.675​
 
5.png


The EURGBP tests the resistance
The EURGBP pair formed correctional bullish rally to test the major resistance at 0.8720 followed by bouncing negatively towards 0.8580, to confirm keeping the domination of the bearish bias for the upcoming trading.

We notice the price attempt to crawl below the moving average 55, also, stochastic begins to provide the negative momentum to assist to renew the negative attempts, to expect reaching 0.8510 followed by targeting 38.2% Fibonacci correction level near 0.8410.

eurgbp-tech.png
 
5.png


The EURJPY repeats the negative closings
The EURJPY pair repeated the negative closings below 144.25 recorded high, which forms strong obstacle against the attempt to resume the bullish attack for now, which allows us to keep the correctional bearish overview for the near term and medium term period.

The above chart shows stochastic continuous negative waves, to increase the chances of gathering the negative momentum, to keep waiting to touch the negative stations at 142.20 followed by reaching 140.90.

eurjpy-tech.png


The expected trading range for today is between 143.70 and 142.20​
 
5.png


The USDCHF resumes the decline.
The USDCHF pair achieved temporary gains yesterday and approached 0.9630 level, but it bounced bearishly to reach the thresholds of 0.9525 level, to keep the bearish trend scenario valid and active, waiting to break the last level to confirm rallying towards 0.9400 as a next station.

We remind you that the continuation of the bearish wave depends on the price stability below 0.9630.

usdchf-tech.png


The expected trading range for today is between 0.9500 support and 0.9600 resistance.​
 
Back
Top