Solid ECN | Daily Technical | Video | Major Products

USDCHF - lateral channel correction

The strengthening of the franc was supported by data on Imports volumes, which in June reflected an increase of 0.3% compared with the previous month, while the Producer Price Index reached 109.8 points, adding 6.9% compared to the same period a year earlier. The real estate market is mixed, with Civil Construction Spending up 0.1% year-over-year and Construction Overall Spending reduced by 0.4%, resulting in a 0.1% decrease in Total Investment in the sector.

usdchf.png


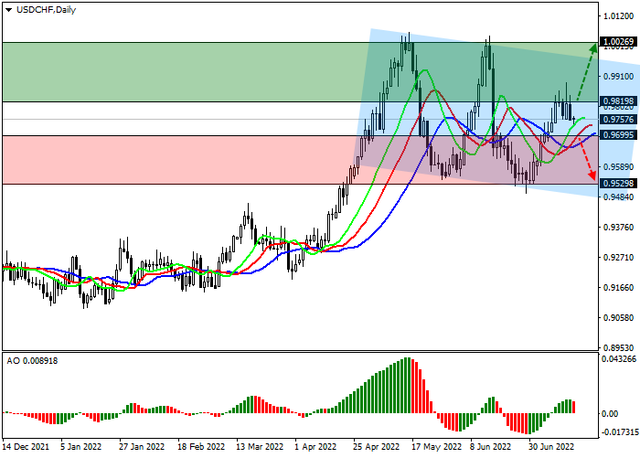
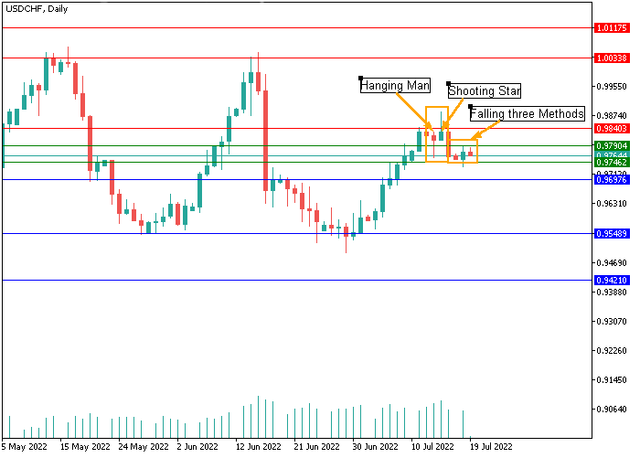
On the global chart of the asset, the price is correcting within the side channel, preparing to continue the global growth. Technical indicators maintain a steady buy signal: the fast EMAs of the Alligator indicator are significantly above the signal line, and the histogram of the AO oscillator is held in the buy zone, forming local corrective bars.

Support levels: 0.9699, 0.9529 | Resistance levels: 0.9819, 1​
 
BTCUSD

The BTCUSD pair continues to trade within the framework of a long-term downtrend, however, in the last few weeks the decline has slowed down, and the price has formed a sideways range of 18750 - 22500, within which it remains at the present time. Now the quotes of "digital gold" are testing its upper limit, the breakout of which will allow us to continue moving to the levels of 25000 and 28125. The key for the "bears" is the mark of 18750, at the breakdown of which the downward dynamics will resume to the range of 15625, 12500 and 10000.

btc.png


In general, the long-term downward trend is still maintained, but in order for it to continue, quotes need to break through the current side channel. Judging by the indicators illustrating the uncertainty of the market, a trend change is unlikely in the near future, and the price will continue to move sideways.

Resistance levels: 22500, 25000, 28125, 31250 | Support levels: 18750, 15625, 12500, 10000​
 
NI 225 - Japanese stock market started the week with growth

Fast Retailing Co., Ltd., which posted a positive Q3 financial report, remains the leader on the Japanese stock market. The revenue of 546.13 billion yen was posted, higher than analysts' forecast of 508.8 billion yen, and earnings per share of 890.55 yen, the second-highest on record after 916.21 yen in Q4 2021. Moreover, according to preliminary estimates, at the end of this year, the holding's management expects to receive total revenue of 2.25 trillion yen and a net profit of 250 billion yen, having improved the previous figures by 5.5% and 47%, respectively.

nik.png


On the global chart, the index quotes remain within the local lateral channel, moving towards the resistance line. Technical indicators are about to reverse and give a buy signal: the histogram of the AO oscillator is decreasing in the sell zone, forming new ascending bars, and fast EMAs on the Alligator indicator continue to move away from the signal line.

Support levels: 26500, 25550 | Resistance levels: 27470, 28340​
 
USDCHF - technical analysis

H4

A Double Top price pattern is forming on the four-hour chart, and the USD/CHF quotes are currently near the Neck line, overcoming which will mean the continuation of the active phase of decline. The negative dynamics is intensified by the appearance at the resistance level of 0.9840 of the Shooting Star and Hanging Man figures following each other. In addition, the downward movement is due to the formation of the Three Black Crows trend continuation pattern in the range of 0.9840–0.9790. Currently, the asset has formed another Shooting Star candlestick analysis pattern at 0.9790, which signals growing "bearish" sentiment in the market. In the current situation, the scenario with a decrease in the trading instrument to the support level of 0.9697 seems more likely, overcoming which will allow quotes to fall to the area of 0.9548−0.9421. An alternative scenario is possible if the price consolidates above the resistance level of 0.9840 and then moves up to the level of 1.0117.

usdchf-1.png


D1
On the daily chart, at the level of 0.9840, there is the formation of a Hanging Man reversal pattern, which indicates that the quotes have consolidated the top and met with strong resistance. This was confirmed by the formation of a classic Shooting Star candlestick analysis pattern, which similarly illustrates the completion of a "bullish" trend. At the moment, probably, there is a formation of the Falling Three Methods figure, which is a signal for the continuation of the downtrend. If the sellers overcome the support level of 0.9697, one should expect further continuation of the negative dynamics in USDCHF currency pair to the area of 0.9548−0.9421.

Support levels: 0.9697, 0.9548, 0.9421 | Resistance levels: 0.984, 1.0033, 1.0117

usdchf-2.png
 
Shares of PayPal Holdings, a debit payment processor, are correcting at 74.

On the daily chart of the asset, the price is in a wide global channel with dynamic boundaries of 50–81, declining towards the support line, from which it moved away the day before. On the four-hour time frame, it is clearly seen that the quotes are increasingly clamped within the framework of the local Triangle pattern, before the implementation of which there is not much time left. The figure support line coincides with the annual low of 68.5, which can be updated as early as this week.

pypl.png


Technical indicators signal the presence of a weak corrective buy signal: fast EMAs on the Alligator indicator are approaching the signal line, and the AO oscillator histogram is still in the sell zone, forming ascending bars.​
 
Shares of the largest financial conglomerate in the USA, Bank of America adjusted around 32.

On the daily chart of the asset, the price continues to trade within the global downward channel with dynamic boundaries at 25–32, being at the moment near the resistance line, an unsuccessful attempt to overcome which the day before may have given a new impetus to the decline.

bac.png


On a four-hour time frame, it is clearly seen that in order to continue the "bearish" trend, the trading instrument needs to consolidate below the annual low of 30.60, and this is indirectly confirmed by technical indicators that continue to hold a sell signal, completing the technical correction. The range of EMA fluctuations on the Alligator indicator remains quite wide, and fast EMAs have begun to reverse downwards again, and the AO oscillator histogram is forming ascending bars, being in the sell zone, slightly approaching the transition level.​
 
USDJPY - the epidemiological situation in Japan is rapidly deteriorating

The trading instrument is under pressure from reports of a sharp deterioration in the epidemiological situation in Japan, as a number of prefectures recorded record levels of COVID-19 infection. The day before, the number of detected cases reached 110.670K, which is the absolute daily maximum since the beginning of the pandemic. The main focus of the spread continues to be Tokyo, where the statistics reflected 17.709K cases. As for the economic component, already on Thursday the Bank of Japan will publish its decision on the interest rate, and analysts suggest that the rate will be kept at a negative level of –0.10%, as the country's financial authorities prefer to fight the unprecedented inflation by buying assets, rather than tightening monetary conditions.

usdjpy.png


The trading instrument is in the global uptrend, dropping below the annual high of 139. Technical indicators maintain a steady buy signal: the range of EMA fluctuations on the Alligator indicator is still wide, and the histogram of the AO oscillator is forming new multi-directional bars, being high in the purchase area.

Support levels: 136.73, 132.1 | Resistance levels: 139, 142​
 
NZDUSD - New Zealand inflation hits 32-year high

The New Zealand authorities announced the extension of the preferential excise tax on motor fuel due to a decrease in the cost of living of citizens due to record inflation, which reached an annualized rate of 7.3%, the highest value in 32 years. According to the Stats NZ data, published the day before, cost of construction materials increased the most in June, adding 18%, utilities added 7.3% and food products gained 6.5%, while the cost of gasoline increased by 32% in annual terms, and diesel fuel added 74%. Experts believe that against the backdrop of continuing negative dynamics, the Reserve Bank of New Zealand will tighten its monetary policy, raising the interest rate by 0.75 percentage points already at the August meeting. Last week, the regulator already adjusted the figure to 2.50% and announced plans to bring the value to 4.0% by the middle of next year.

nzdusd.png


Quotes of the trading instrument are within the global downtrend, having retreated from the annual low of 0.6096. Technical indicators hold a stable sell signal, but do not exclude local correction: fast EMAs on the Alligator indicator slowly narrow down the range of fluctuations, and the AO oscillator histogram is forming local upward bars.

Support levels: 0.6096, 0.5954 | Resistance levels: 0.6225, 0.6397​
 
Quotes of XAUUSD are correcting in a downtrend, being in the area of 1710.

While most experts expect the US Federal Reserve to increase interest rates, some analysts have begun to openly speak out in favor of the fact that the regulator will not be able to stick to the current "hawkish" course for a long time. The fact is that such a rapid tightening of monetary conditions increases the risks of a recession, which could have a more devastating effect on the economy than the current record inflation. US officials will either raise the rate to the required 4.75%–5%, or refuse such steps altogether, which will lead to an increase in the Consumer Price Index above 10.0%. Whatever scenario the US regulator chooses, this will have a positive effect on the precious metals market, as investors will urgently start looking for a "safe haven" transferring their capital into gold.

gold.png


Despite the positive fundamental background, the technical picture on the price chart does not yet give buying signals: the fast EMAs of the Alligator indicator are below the signal line, and the histogram of the AO oscillator is trading in the sell zone, forming descending bars.

Support levels: 1697, 1650. | Resistance levels: 1725, 1786.​
 
S&P 500 - positive momentum after the publication of corporate reports

One of the world's largest investment banks, a financial conglomerate Goldman Sachs Group, reported income of 11.86 billion dollars, which significantly exceeded the 10.85 billion dollars predicted by analysts. Earnings per share came in at 7.73 dollars amid early market estimates of 6.64 dollars. In turn, the software and consulting services company IBM Corp. showed quarterly revenue of 15.54 billion dollars instead of 15.09 billion dollars expected by experts. Earnings per share came in at 2.31 dollars, also well above the 1.4 dollars reported a quarter ago. The only major market participant that noted negative dynamics in its report was Bank of America Corp.: its revenue fell to 22.69 billion dollars from 22.72 billion dollars and earnings per share were 0.73 dollars, compared to the projected 0.74 dollars.

spx.png


The index quotes continue to trade in the global downward channel, being in the middle of the range. Technical indicators are holding a steady signal to open short positions: the fast EMAs of the Alligator indicator are below the signal line, and the histogram of the AO oscillator is trading in the sell zone, forming multidirectional bars.

Support levels: 3781, 3600 | Resistance levels: 3916, 4100​
 
Back
Top