SOLID ECN LLC
Solid ECN Representative
- Messages
- 515
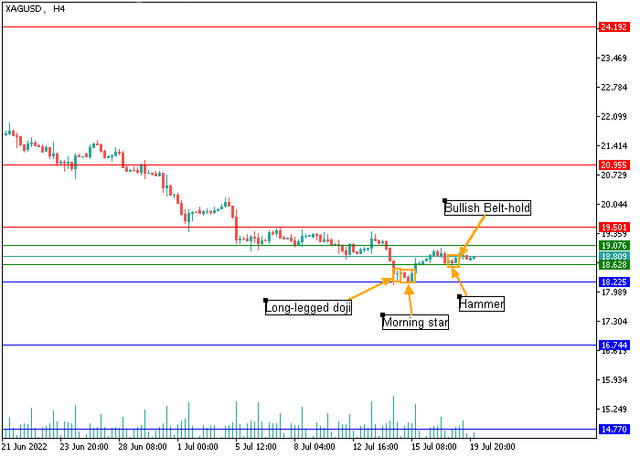
Silver - H4
On the four-hour chart of the asset at the level of 18.22, there is a formation of a Long-Legged Doji candlestick analysis pattern, signaling uncertainty in the market or a possible reversal, which is also confirmed by the formation of the Morning Star pattern, after which the trading instrument showed a price recovery to the level of 19.07. At the moment, the quotes are moving in the sideways range of 18.62–19.07, where the Hammer and Bullish Belt Hold patterns have already appeared. Their combination signals that the asset has probably reached a low and is reversing. At the moment, the uptrend to the resistance level of 19.50 is seen as a priority, consolidation above which will allow the "bulls" to head to the zone of 20.95–24.19. An alternative scenario may be realized if the price breaks the key support level at 18.22, then the decline may intensify up to the level of 14.77.
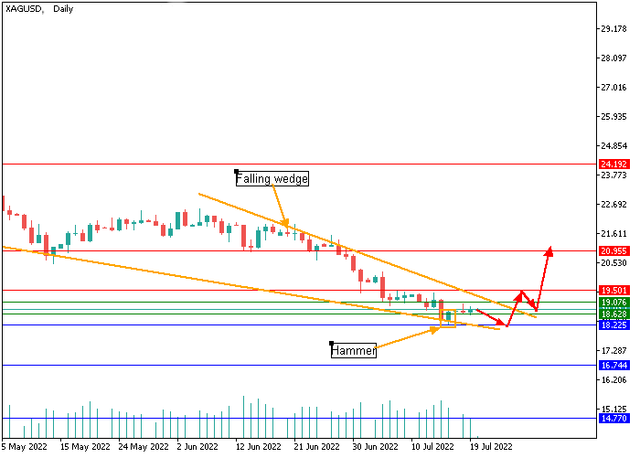
D1
On the daily chart, there is the formation of a Falling Wedge price pattern, which may end at the support level of 18.22, and a Hammer, the appearance of which indicates that the price has reached the bottom. In the current situation, the scenario with an upward movement from the level of 18.22 is seen as a priority. Overcoming the upper border of the Falling Wedge and consolidation of the quotes above 19.50 will mean a final upward reversal and will allow the "bulls" to restore their positions in the range of 20.95–24.19.
Support levels: 18.22, 16.74, 14.77 | Resistance levels: 19.50, 20.95, 24.19
On the four-hour chart of the asset at the level of 18.22, there is a formation of a Long-Legged Doji candlestick analysis pattern, signaling uncertainty in the market or a possible reversal, which is also confirmed by the formation of the Morning Star pattern, after which the trading instrument showed a price recovery to the level of 19.07. At the moment, the quotes are moving in the sideways range of 18.62–19.07, where the Hammer and Bullish Belt Hold patterns have already appeared. Their combination signals that the asset has probably reached a low and is reversing. At the moment, the uptrend to the resistance level of 19.50 is seen as a priority, consolidation above which will allow the "bulls" to head to the zone of 20.95–24.19. An alternative scenario may be realized if the price breaks the key support level at 18.22, then the decline may intensify up to the level of 14.77.
D1
On the daily chart, there is the formation of a Falling Wedge price pattern, which may end at the support level of 18.22, and a Hammer, the appearance of which indicates that the price has reached the bottom. In the current situation, the scenario with an upward movement from the level of 18.22 is seen as a priority. Overcoming the upper border of the Falling Wedge and consolidation of the quotes above 19.50 will mean a final upward reversal and will allow the "bulls" to restore their positions in the range of 20.95–24.19.
Support levels: 18.22, 16.74, 14.77 | Resistance levels: 19.50, 20.95, 24.19