Solid ECN | Daily Technical | Video | Major Products

Gold Elliot wave analysis by Solid ECN

The pair may grow.

On the daily chart, the fifth wave of the higher level (5) develops, within which the first entry wave 1 of (5) formed, the correctional wave 2 of (5) developed, and the wave 3 of (5) forms. Now, the first wave of the lower level i of 3 is developing, within which a local correction has ended as the wave (iv) of i, and the fifth wave (v) of i is developing. If the assumption is correct, the pair will grow within the wave to the levels of 1919.90–2067.60. In this scenario, critical stop loss level is 1752.82.​

gold_1.pnggold_2.png
 
Last edited:
EURUSD Technical Analysis by Solid ECN


EUR/USD updates local highs of November 11

Current trend
The European currency shows a moderate increase against the US dollar during the Asian session, ending the week with growth. The instrument is testing 1.1470 for a breakout, updating the local highs of November 11.

Before the end of the day, the market will receive quite a lot of noteworthy publications, so the situation may well change; however, judging by the forecasts of investors, the dollar will remain under pressure. In particular, US Retail Sales data for December is expected to reflect a drop in sales volumes from 0.3% to zero levels. At the same time, the Michigan Consumer Sentiment Index may retreat from 70.6 to 70 points.

Investors are looking forward to today's speech by the President of the European Central Bank (ECB), Christine Lagarde, who is likely to pay considerable attention to the growing risks associated with the spread of a new wave of coronavirus cases. The issue of tightening monetary policy in the eurozone is still open.

Support and resistance
Bollinger Bands in D1 chart show moderate growth. The price range is expanding but it fails to conform to the surge of "bullish" sentiments at the moment. MACD grows, preserving a stable buy signal (located above the signal line). Stochastic, having reached its highs, is expected to reverse into a horizontal plane, indicating significant risks associated with the euro being overbought in the ultra-short term.

Resistance levels: 1.1500, 1.1534, 1.1572, 1.1600.
Support levels: 1.1460, 1.1422, 1.1400, 1.1363.​

eurusd_1.pngeurusd_2.png
 
AUDUSD Technical Analysis by Solid ECN


The instrument is correcting at the end of the week

Current trend

The Australian dollar shows mixed trading dynamics against the US dollar during the Asian session, correcting after strong growth at the beginning of the week, which led to the renewal of local highs from November 16. The pressure on AUD/USD is exerted by technical factors, as well as by the oversold US currency in almost the entire spectrum of the market.

In turn, the instrument is supported by optimistic data from Australia and China. Home Loans in Australia increased by 7.6% in November after falling by 4.1% in October. Analysts expected zero dynamics. The Investment Lending for Homes over the same period also increased from 1.1% to 3.8%. Data from China showed stronger export growth in December: 20.9% against the expected 20.0%. Together with a slowdown in import dynamics from 31.7% to 19.5%, this led to a significant increase in the trade balance in December from 71.72B to 94.46B dollars.

Support and resistance
Bollinger Bands in D1 chart show moderate growth. The price range expands from above, freeing a path to new local highs for the "bulls". MACD indicator is growing, while preserving a rather stable buy signal (located above the signal line). Stochastic keeps its upward direction but is approaching its highs rapidly, which reflects risks of the overbought instrument in the ultra-short term.

Resistance levels: 0.7300, 0.7328, 0.7369, 0.7408.
Support levels: 0.7250, 0.7200, 0.7160, 0.7128.​

audusd_1.pngaudusd_2.png
 
CAC 40 Technical Analysis by Solid ECN Securities


Current trend
The CAC 40 index is correcting down ahead of the start of the annual reports of companies, being at around 7133.0.

The main wave of publication of financial results will start next week. Tech stocks have been leading throughout the week due to a correction in the bond market. Among the growth leaders are the shares of software maker Sopra Steria Group SA, whose annual profit forecast was significantly raised, exceeding 5B euros. Now the company's shares are growing by 5.67% and, apparently, the positive dynamics may continue.

The main support for technology companies comes from the bond market, which continues a serious downward correction. At the beginning of this week, 10-year bonds traded at a yield of 0.298%, and now the figure has fallen to 0.229%. However, the most significant downtrend is shown by 8-year bonds of France, the yield on which only yesterday fell by 42.86%, and now has returned to the negative zone again at the level of -0.030%.

The growth leaders in the index are Renault SA (+4.58%), Stellantis NV (+3.45%), STMicroelectronics NV (+3.09%), BNP Paribas SA (+2.50%).

Among the leaders of the decline are Kering SA (-3.61%), Hermes International (-3.17%), L’Oreal SA (-2.81%), Teleperformance SE (-2.67%).

Support and resistance
The quotes of the asset are traded within the global ascending channel, having reversed downwards. Technical indicators maintain a weakening buy signal: the range of the Alligator indicator EMAs fluctuations began to narrow down and the histogram of the AO oscillator forms descending bars, being above the transition level.

Support levels: 7074.0, 6720.0.
Resistance levels: 7238.0, 7450.0.​

cac40.png
 
Cryptocurrency Market Review


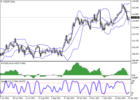
This week, the cryptocurrency market attempted to grow. As a result, the leading assets strengthened their positions. Currently, BTC is trading around 42800.00 (+1.2%), ETH is at 3300.00 (+3.5%). The BNB token returned to third place and is moving around 485.00 (+10.2%). USDT is at 1.0004 (+0.02%) and SOL is around 148.00 (+4.5%). The total market capitalization reached 2.051T dollars by the end of the week. The share of BTC has decreased to 39.55%.

The upward movement of the market is likely to be speculative since there are no obvious fundamental growth factors. Support for digital currencies and other alternative assets was provided by the general weakening of the US dollar associated with high inflation in the United States and investors' doubts about the ability of the US Federal Reserve to limit it this year.

Traders are focused on the comments of US officials. In an interview with CNBC, the head of the US Securities and Exchange Commission (SEC), Gary Gensler, evaded the question of whether ETH is security, saying that the commission did not give public legal advice. However, Gensler noted that companies that collected money from citizens and promised them profits could fall under securities laws. He also confirmed the need to create legal mechanisms that allow investors to receive all the necessary information from cryptocurrency companies before investing. The SEC continues the lawsuit with Ripple, proving that the XRP token was a security, and the company's management violated relevant US law when creating it. Ripple lawyers are trying to get an explanation from the regulator about why it considers XRP security, while several other currencies, in particular ETH, do not, hinting at the agency's bias. In this context, Gensler's refusal to comment on the status of ETH may indicate the weakness of the regulator's position and the prospects for Ripple to win the lawsuit. On Tuesday, at a Senate hearing, US Federal Reserve Chairman Jerome Powell promised to submit a report on studying the prospects for a national digital currency (CBDC) soon, which will be an important step towards creating a digital dollar. Powell also said that CBDC would not force private stablecoins out of the market, and they would be able to coexist.

From the news of the financial industry, it is worth noting the possibility of launching the payment company PayPal Holdings Inc.'s stablecoin backed by the US dollar, according to Bloomberg sources. Employees of the corporation note that the new currency should ensure the expansion of payments and customers' security. The product is currently under development and is awaiting approval from US regulators. Meanwhile, payment giant Visa Inc. in collaboration with ConsenSys, develops a technical solution for using state digital currencies in everyday payments. The corporation's management said that the company has already held consultations with the central tanks of several countries. The implementation of the new solution will allow customers to make any payments using CBDC at all points that accept Visa cards. Corporation employees surveyed small businesses in nine countries and found that 24% of them are ready to accept payments in the digital currency this year. Not surprisingly, the public's continued adoption of crypto assets is pushing Visa Inc. and other major financial companies to expand their cryptocurrency services. Finally, this week, it became known that Tesla Inc. is preparing to sell some of its products for DOGE and SHIB tokens. Currently, payment technologies are being tested, but the purchase itself is not yet available. Given the constant support of the head of the corporation Elon Musk of digital assets, especially DOGE, it can be assumed that payments in cryptocurrencies will be accepted soon.

Next week, quotes of most cryptocurrencies may consolidate or resume their decline.​
 
WTI Crude Oil, Elliot Wave Analysis
The price may grow​


On the daily chart, the upward wave C forms, within which the first wave 1 of (1) of C develops. Now, the fifth wave of the lower level v of 1 of (1) is developing, within which the wave (iii) of 1 is forming. If the assumption is correct, the price will grow to the levels of 93.00–100.00. In this scenario, critical stop loss level is 65.93.​

oil_1.pngoil_2.png
 
USD/CHF, the US currency is recovering


Current trend
The US dollar shows strong growth against the Swiss franc during the Asian session, building on the "bullish" momentum that was formed at the end of last week, when the pair consolidated near the local lows of November 2, 2021. At the moment, the development of the uptrend is mainly supported by technical factors, while the block of data from the US released on January 14 turned out to be frankly weak.

In particular, investors were disappointed by the sharp drop in Retail Sales in December by 1.9% after rising by 0.2% in November. The Retail Sales Control Group fell to a record 3.1% over the same period after falling 0.5% in November. Michigan Consumer Sentiment Index in January fell from 70.6 to 68.8 points, while analysts had expected a decline to only 70 points.

Markets in the US are closed today to celebrate Martin Luther King, Jr. Day, so trading activity is likely to be somewhat reduced.

Support and resistance
Bollinger Bands in D1 chart demonstrate flat dynamics. The price range is changing slightly, but remains rather spacious for the current level of activity in the market. MACD is going down preserving a previous sell signal (located below the signal line). Stochastic, which has reached its lows, is trying to reverse upward, signaling in favor of the development of corrective growth in the nearest time intervals.

Resistance levels: 0.9157, 0.9175, 0.9200, 0.9220.
Support levels: 0.9125, 0.9100, 0.9073, 0.9036.​

usdchf_1.pngusdchf_2.png
 
Silver, Elliot Wave Analysis


The pair may grow.
On the daily chart, the first wave of the higher level (1) of 3 formed, a downward correction developed as the wave (2) of 3, and the development of the third wave (3) of 3 started. Now, the first wave of the lower level i of 1 of (3) has formed, a local correction has developed as the wave ii of 1, and the formation of the wave iii of 1 has started, within which the development of the wave (iii) of iii has started. If the assumption is correct, the price will grow to the levels of 26.76–28.68. In this scenario, critical stop loss level is 21.91.​
 

Attachments

  • silver_1.png
    silver_1.png
    23.6 KB · Views: 1
  • silver_2.png
    silver_2.png
    20.7 KB · Views: 1
Netflix Inc, Elliot Wave Analysis


The price may fall.
On the daily chart, the third wave of the higher level (3) developed, and a downward correction started to develop as the fourth wave (4). Now, the wave and of (4) is forming, within which the third wave of the lower level iii of A has formed, and a local correction is developing as the wave iv of A. If the assumption is correct, after the end of the correction, the price will fall to the levels of 465.32–411.70. In this scenario, critical stop loss level is 620.94.​

netflix_1.pngnetflix_2.png
 
USD/JPY: US dollar wins back its losses

Current trend
The US dollar shows strong growth against the Japanese yen in Asian trading, quickly retreating from local lows, updated at the end of the last trading week. On Friday, the US currency updated its lows from December 20, 2021, dropping just below 113.50. Nevertheless, the instrument failed to consolidate at new levels, and already on the same day the US dollar won back most of its losses.

It is also worth noting that on Friday a large block of macroeconomic statistics was released in the US, which turned out to be quite weak, but did not cause the expected negative reaction on the market. Anyway, along with a significant drop in Retail Sales, the data also reflected a decline in Industrial Production in December by 0.1%, while analysts had expected it to grow moderately by 0.4%. Michigan Consumer Sentiment Index in January fell from 70.6 to 68.8 points, which turned out to be worse than forecasts for a decline to 70 points.

Support and resistance
In the D1 chart, Bollinger Bands are reversing horizontally. The price range is expanding from below, remaining spacious enough for the current activity level in the market. MACD is going down preserving a stable sell signal (located below the signal line). The indicator is about to test the zero level for a breakdown. Stochastic, on the contrary, indicates the growth of the instrument. The indicator reversed upwards near its lows, reflecting the strongly oversold dollar in the ultra-short term.

Resistance levels: 114.50, 115.00, 115.50, 116.00.
Support levels: 114.00, 113.50, 113.00, 112.50.​
 

Attachments

  • usdjpy_1.png
    usdjpy_1.png
    26.7 KB · Views: 1
  • usdjpy_2.png
    usdjpy_2.png
    26 KB · Views: 1
Back
Top