Solid ECN | Daily Technical | Video | Major Products

USDCHF - Candlestick analysis
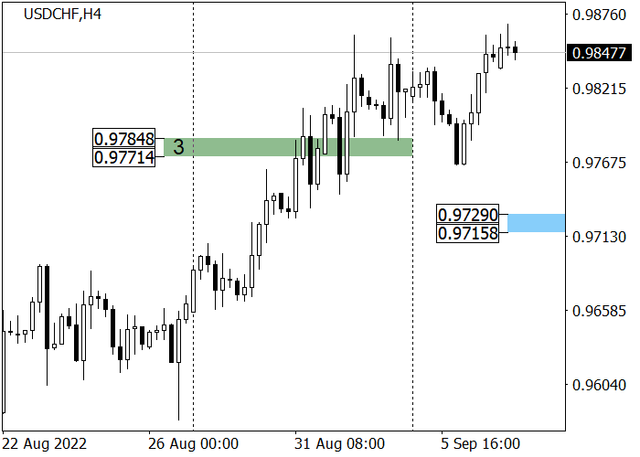
H4

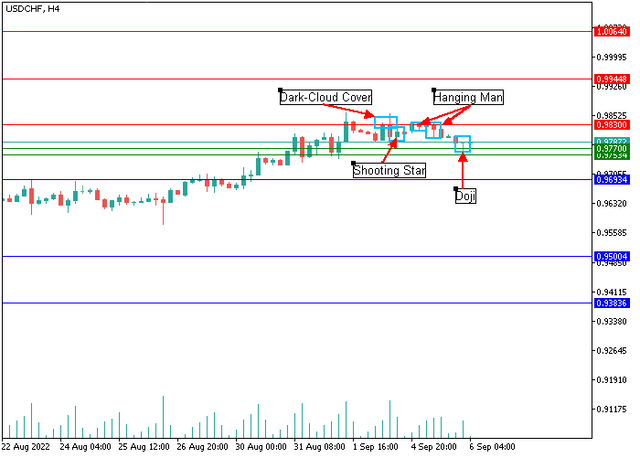
On the four-hour chart, at the resistance level of 0.983, there is the formation of a reversal candlestick analysis pattern Dark-Cloud Cover, as well as a Shooting Star pattern, signaling a shift in forces towards sellers. In addition, it is worth noting the appearance of two Hanging Man patterns at once, which confirm the achievement of the top by the asset, and the Doji pattern above the level of 0.977, which warns of uncertainty in the market and an imminent trend change in the USDCHF pair. Thus, the most likely scenario is the asset's decline to the support level of 0.9693, the overcoming of which will intensify the negative dynamics up to the level of 0.9383. An alternative scenario is possible if the "bulls" manage to consolidate their positions above the resistance level of 0.9830, then the price may recover to the zone of 0.9944 – 1.0064.
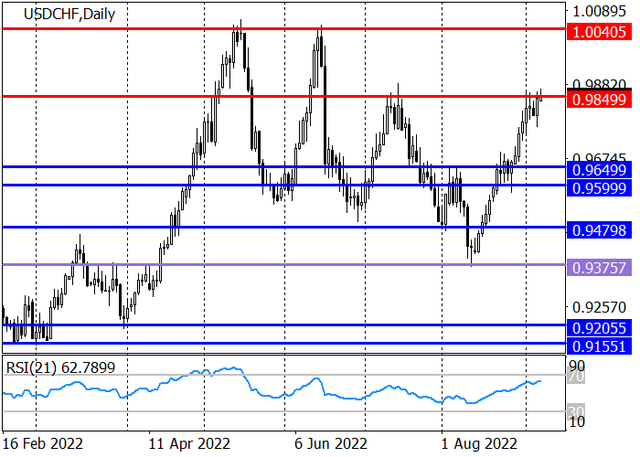
usdchf-1.png


D1
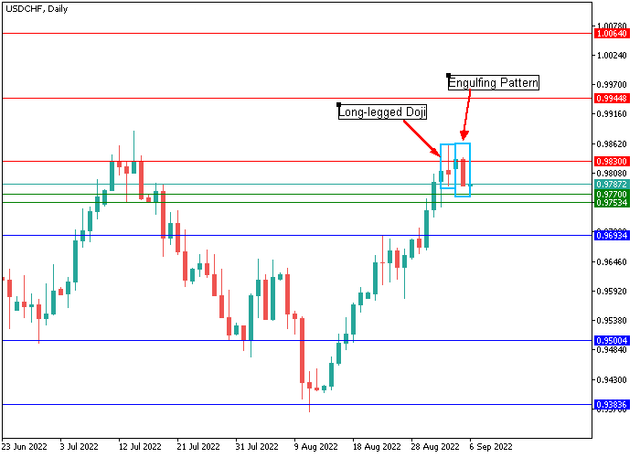
On the daily chart, a Long-Legged Doji candlestick pattern is being formed, which notifies of a price reversal at the top, as well as a Bearish Engulfing pattern, signaling a loss of control over the market by buyers. In the current situation, most likely, the asset will go down to the support level of 0.9693, the overcoming of which will allow quotes to continue moving towards the area of 0.95 – 0.9383.

Support levels: 0.9693, 0.95, 0.9383 | Resistance levels: 0.983, 0.9944, 1.0064

usdchf-2.png
 
FTSE 100 - the stock market shows an upward trend

The key event, which continues to influence all segments of the UK market, remains the results of the elections for the post of Head of the Conservative Party and of the British government, which were won by Liz Truss, who until now held the position of Secretary of Foreign Affairs. She overtook her main opponent, former finance minister Rishi Sunak, with 81.326 thousand votes. The official will have a rather tense start to her post as the national economy is in dire need of support and the population is counting on additional subsidies to pay for skyrocketing electricity and heating bills. Incumbent officials resigned ahead of the formation of a new cabinet: Home Secretary Priti Patel, Government Minister of State Nigel Adams, Home Office deputy head for security Stephen McPartland and Culture Minister Nadine Dorries. It is still difficult to assess what innovations in domestic policy will be adopted, but experts are confident that Liz Truss will continue the course of the previous Prime Minister Boris Johnson and serious changes should not be expected.

ftse.png


The index quotes are traded within the global side channel, approaching the lower border. Technical indicators are holding a sell signal, which has not weakened even against the background of the current upward correction: the range of the Alligator indicator EMAs fluctuations continues expanding and the histogram of the AO oscillator forms descending bars.

Support levels: 7177, 6994 | Resistance levels: 7335, 7565​
 
Shares of The Walt Disney, the leader in the global entertainment industry, are on a corrective downtrend at 110.

On the daily chart, the quotes have left the global downwards channel with dynamic boundaries 80–108, having overcome the resistance line at 107 with a gap that can be worked out this week. On the four-hour chart, it can be seen that despite the working out of the price gap of 108–117, the downside movement potential is limited. The most promising at the moment looks like a possible reversal and subsequent growth of the asset with the consolidation above the initial correction level of 23.6% Fibonacci around 117.

dis.png


Technical indicators hold a buy signal despite a significant slowdown: indicator Alligator’s EMA oscillation range actively narrows, and the histogram of the AO oscillator is forming bars with a downward trend in the buying zone.​
 
XAUUSD - Quotes failed to consolidate at the August highs

Gold prices are moderately declining, developing the "bearish" momentum formed the day before. The XAU/USD pair failed to consolidate on Tuesday at its local highs of August 30, reacting to the publication of positive macroeconomic statistics from the US.

gold-1.png


The downtrend in demand for gold, which began in early August, is still observed. According to the report of the US Commodity Futures Trading Commission (CFTC), last week the number of net speculative positions in the precious metal corrected from 125.8 thousand to 117.7 thousand, thus, the tendency for sellers to reduce their positions continues. "Bears" still hold the lead in market positions, but the number of positions of "bulls" has also significantly adjusted, amounting to 21.925 thousand against 53.688 thousand for sellers. This week, buyers liquidated 0.615 thousand contracts, while sellers liquidated 2.989 thousand.

gold-2.png


Bollinger Bands in D1 chart demonstrate a moderate decrease. The price range widens marginally, following the resumption of "bearish" momentum in the ultra-short term. MACD is declining keeping a weak sell signal (located below the signal line). Stochastic is reversing downwards after a short rise at the end of the last trading week, indicating the risks of the development of "bearish" dynamics in the nearest time intervals.

Resistance levels: 1700, 1720, 1730, 1752.87 | Support levels: 1688.5, 1675, 1660.1, 1644.3​
 

XRPUSD - Downward dynamics​

The XRP coin is moving within a corrective sideways channel, reversing downwards, and is currently at 0.3166.

xrp-1.png


H4
On the four-hour chart of the asset, the local downward wave is a narrow corridor within which the price rebounded from the resistance line at 0.3417 and reversed downwards with the target at the lower border of the 0.27 range. Technical indicators gave a signal to sell: indicator Alligator’s EMA oscillation range expands downwards, and the histogram of the AO oscillator is actively decreasing in the sell zone.

xrp-2.png


D1
On the daily chart, a sideways channel forms with dynamic boundaries of 0.2950–0.4240, while the price continues to decline towards the support line at 0.2950. Technical indicators strengthen the sell signal: indicator Alligator’s EMA oscillation range expands, and the histogram of the AO oscillator forms new downward bars. In general, both charts indicate a likely continuation of the downward movement, the global target is to exit the sideways channel and decline to a historical low of around 0.2350.

Resistance levels: 0.3520, 0.4215 | Support levels: 0.2950, 0.2350
 
USDCHF - the pair has reached a strong resistance level of 0.9850

The USDCHF pair has reached the resistance level of 0.985, and the probability of further growth remains against the backdrop of the upcoming US Federal Reserve meeting, at which the regulator may raise the rate by 75 basis points, which will strengthen the position of the US dollar.

Meanwhile, the EU economy is under pressure: the lack of energy resources, rising inflation, and a slowdown in gross domestic product (GDP) growth, and since Switzerland has close economic ties with the EU, negative factors are reflected in the macroeconomic indicators of this country as well. On Monday, Q2 GDP was published: the value consolidated around 2.8% YoY, which was worse than analysts' expectations of 3.0%, and it added 0.3% QoQ compared to the forecast of 0.4%.

usdchf-1.png


Thus, the likelihood of further weakening of the Swiss franc remains, and the long-term trend in the USD/CHF pair is likely to continue. For the development of positive dynamics, the "bulls" need to overcome the resistance level of 0.9850 and consolidate above it, and then the target for purchases will be 1.0040 around the highs of May-June 2022.

usdchf-2.png


The medium-term trend remains upward. Last week the market participants broke through the target zone 3 (0.9784–0.9771), and the next target for purchases is zone 4 (0.9926–0.9912). The key support is shifting to 0.9729–0.9715, and if the price corrects into this area, then new long positions in the asset should be considered.

Resistance levels: 0.985, 1.004 | Support levels: 0.965, 0.96​
 
ADAUSD - Candlestick Analysis

H4

The four-hour chart shows the formation of a Bullish Engulfing pattern, which included a reversal candlestick Hammer, as well as the appearance at the level of 0.4718 of the Three Advancing White Soldiers and Hammer patterns. The combination of these patterns signals that the asset has reached the bottom level, where buyers have become active. In the current situation, a scenario with the uptrend to the resistance level of 0.5831 seems likely, overcoming which will open the way for the "bulls" to the area of 0.7820–0.9362. An alternative scenario is likely in case the "bears" break through the key support level of 0.4159, and then the decline may intensify up to the level of 0.2098.

ada-1.png


D1
The daily chart shows that the asset has been consolidating for a long time in the range of 0.4159–0.5831, which may indicate a likely upward reversal. In addition, the fact that the asset has reached the area of low prices, where the "bulls" have activated, is also signaled by the formation of Hammer and Inverted Hammer reversal patterns, while another Bullish Engulfing reversal pattern has formed below the level of 0.4718, which included the Inverted Hammer candle. At the moment, the upward dynamics to the level of 0.5831 seems to be the most probable. In case of a breakout of the key resistance level, the asset may recover higher to the area of 0.7820–0.9362.

Support levels: 0.4159, 0.3031, 0.2098 | Resistance levels: 0.5831, 0.7820, 0.9362​
 
GBPUSD - quotes have renewed the minimum of 2020

Members of the US Federal Reserve are unanimous in their opinion that the main interest rate should be further increased, and already at the September meeting, the value can be adjusted immediately by 75 basis points and brought to 3.75 – 4% next year. The regulator's policy implies a reduction in the balance sheet and a tightening of monetary policy to control record inflation and bring it to a neutral indicator of 2% YoY. The US swaps in the market place an 80% chance of a 75 bps rate hike, and the market is pricing hawkish rhetoric from the financial authorities ahead of time.

gbpusd-1.png


The long-term downtrend for the GBPUSD instrument is likely to continue, and for this, the “bears” need to break the 2020 low at 1.144. After consolidation below it, the next sales target will be 1.13; if it is held, an upward correction with the targets 1.1695 and 1.1770 will begin.

gbpusd-2.png


The medium-term trend remains downward. Last week the traders broke through the target zone 2 (1.1572–1.1536), and the next sell target is zone 3 (1.1212–1.1176), while the key resistance is shifting to 1.1801–1.1765. If reached, it will be possible to consider new short positions with the first target at the current week's low of around 1.1410.

Resistance levels: 1.1695, 1.1768 | Support levels: 1.144, 1.13​
 
EURUSD - Market awaiting ECB interest rate decision

Thus, the Q2 EU economy increased by 0.8%, which exceeded the forecasted 0.6%: gross domestic product (GDP) growth amounted to 4.1% YoY compared to 5.4% in the previous period. Nevertheless, it was higher than preliminary estimates of 3.9%, allowing the European Central Bank to continue tightening monetary policy parameters without fear of a possible recession. At the moment, analysts expect an interest rate hike of 75 basis points from 0.5% to 1.25%, but this forecast was made without considering yesterday's GDP data, which means that the agency can act more aggressively by adjusting the value by 100 basis points.

The American currency did not stay at absolute highs for a long time, and by the end of yesterday's trading fell below 110 in the USD Index and is now trading around 109.7. The main reason for the negative dynamics of the asset was the disappointment of investors in mortgage interest rates: the indicator almost reached an absolute maximum of 6%, amounting to 5.94%, and against this background, demand for mortgages in the United States fell to a minimum in 22 years. The index of the number of mortgage applications fell to 258.1 points from 705.6 points at the beginning of the year, and the downward trend continues.

eurusd.png


The trading instrument is moving toward the support line within the global downward channel. Technical indicators keep a stable sell signal: fast EMAs on the Alligator indicator are below the signal line, and the AO oscillator histogram forms downward bars in the sell zone.

Resistance levels: 1.007, 1.037 | Support levels: 0.9862, 0.965​
 
Crude Oil - The market is waiting for India's decision on the introduction of a cap on oil prices from the Russian Federation

Brent Crude Oil is correcting slightly above 88 after losing significantly yesterday amid forecasts from the Energy Information Administration of the US Department of Energy (EIA), as well as due to India's possible entry into the ceiling level discussion of the oil price.

As Deputy Secretary of the Treasury Wally Adeyemo told Bloomberg, the Indian authorities are currently studying the initiative of the G7 members, which, also to limited pricing, involves a ban on the insurance of ships transporting Russian oil at a higher cost. Investors fear that if restrictions are approved by the key buyer of oil from the Russian Federation, the demand for resources may decrease significantly, which will undoubtedly affect the price. We also recall yesterday's statement by Russian President Vladimir Putin, who stressed that no oil would be supplied to countries that supported the decision to introduce a marginal cost level.

oil.png


On the daily chart, the price is moving within a downwards corridor, gradually approaching the support line. Technical indicators maintain a stable sell signal: fast EMAs of the Alligator indicator are moving away from the signal line, and the AO oscillator histogram is forming down bars in the sell zone.

Resistance levels: 91.53, 98.82 | Support levels: 86.85, 79.95​
 
Back
Top