Solid ECN | Daily Technical | Video | Major Products

USDCAD - The pair is retreating from local highs

Last Friday, renewed June data on retail sales in Canada was published, which provided little support to the national currency: the core index was 0.8% MoM against the forecast of 0.9%, but in annual terms, the indicator consolidated around 1.1% against the background of preliminary estimates of experts at 0.3%. Retail sales excluding cars for the same period adjusted from 1.9% to 0.8%. Another negative factor that influenced the dynamics of the trading instrument was the publication of the July index of prices for new housing in Canada, which rose by 0.1% but did not live up to the forecast of 0.3% and was worse than the previous value of 0.2%.

As for the US economy, the core retail sales index for July added 0.4%, exceeding the forecast of –0.1%. However, the volume of retail sales for July remained unchanged, showing a value of 0.0%, against the preliminary estimates of 0.1%. Next month, traders expect the US Federal Reserve to raise interest rates in the range of 0.50% to 0.75%, and the market is already pricing this scenario into the value of assets, primarily the US dollar. If the experts' expectations are justified, the US dollar will continue to strengthen, and, accordingly, the USD/CAD pair will rise with the target at the July high of 1.3218.

usdcad-1.png


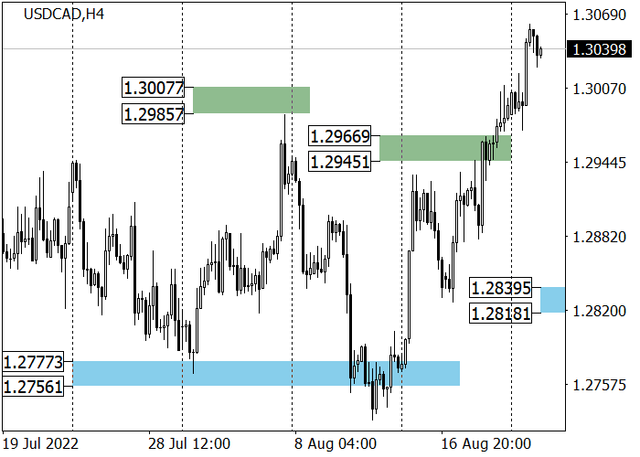
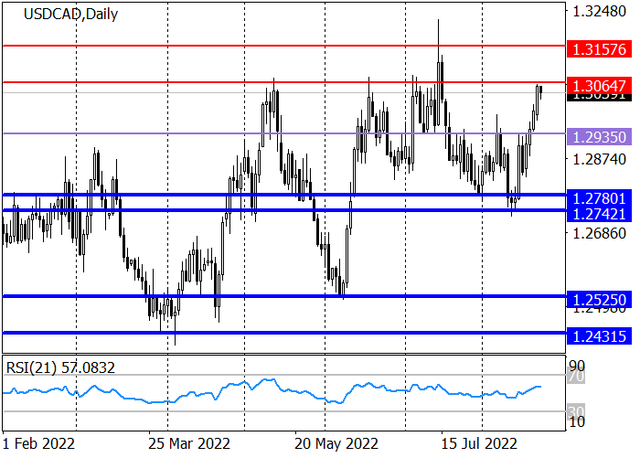
The long-term trend is upwards. The key support area formed in the price range 1.2780–1.2740, and the buyers held it. As a result, the upward dynamics will continue to 1.3157 and 1.3218. The mid-term trend changed to an uptrend last week. The trading instrument broke the target zone 1.2966–1.2945, and the next target is zone 2 (1.3192–1.3170). The key trend support is shifting to 1.2839–1.2818, and in case of correction of quotes to this area, it will be possible to open new long positions.

Resistance levels: 1.3065, 1.3157, 1.3218 | Support levels: 1.2935, 1.2780, 1.2740

usdcad-2.png
 
FTSE 100 - British business activity data disappointed investors

The UK stock market this week will remain focused on today's publication of data on business activity in the leading sectors of the economy. As analysts expected, the slowdown in indicators continued, which in the long term is a negative signal. Manufacturing PMI decreased to 46.0 points from 52.1 points, and Services PMI amounted to 52.5 points after 52.6 points recorded in the previous period.

In the corporate segment, the telecommunications company Vodafone Group Plc. sold its Hungarian division 4iG Public Limited. The amount of the deal is estimated at 1.78 billion dollars, and some experts consider it too low. In turn, the UK bond market continues its upward correction: the yield on 10-year government bonds amounted to 2.514%, while the rate on conservative 20-year bonds again reached its June peak at around 2.929%.

ftse.png


Quotes of the index continue to trade within the global side channel, approaching the upper limit. Technical indicators are holding a buy signal, which has recently begun to weaken: the range of the Alligator indicator EMAs fluctuations started to narrow down and the histogram of the AO oscillator forms descending bars.

Support levels: 7456, 7200 | Resistance levels: 7558, 7693​
 
GBPUSD - the pound tries to recover from record lows

The British pound is showing mixed dynamics, testing 1.1830 for a breakout. The day before, the GBPUSD pair showed a moderate corrective growth, which was partly caused by the depreciation of the US currency in almost the entire spectrum of the market.

Among other things, pressure on dollar quotes was exerted by weak macroeconomic statistics from the US. Thus, the Manufacturing PMI from S&P Global in August corrected from 52.2 points to 51.3 points, although analysts expected a decrease to only 52 points, and the Services PMI fell sharply from 47.3 points to 44.1 points, while it was expected that the indicator would rise to 49.2 points. However, it should be noted that the British statistics also turned out to be disappointing: the Services PMI in August corrected from 52.1 points to 46.0 points, while the forecast was at the level of 51.1 points.

Investors today are in no hurry to open new trading positions, preferring to wait for the results of the symposium in Jackson Hole, which is to be addressed by US Federal Reserve Chairman Jerome Powell. The official is expected to give clear signals on the pace of interest rate hikes in September and beyond, as well as comments on the prospects for a recession amid deteriorating energy markets.

gbpusd-1.png


Meanwhile, London Mayor Sadiq Khan said most people in the country will not be able to pay their heating bills and even afford food this winter amid record inflation, which has reached 10.1% in annual terms, the highest since 1982. According to Bloomberg analysts, electricity tariffs will reach 4K pounds per month by January next year. The UK Office of Gas and Electricity Markets (Ofgem) may set a price ceiling of around 4.266K pounds in the first months of next year, nearly 0.650K pounds more than the agency's previous forecast.

gbpusd-2.png


Bollinger Bands in D1 chart demonstrate a moderate decrease. The price range expands from below, making way for new local lows for the "bears". MACD is going down, keeping a fairly stable sell signal (located below the signal line). Stochastic, having retreated from its lows, is trying to recover, indicating the corrective growth development in the near future.

Resistance levels: 1.1854, 1.1933, 1.2, 1.2054 | Support levels: 1.18, 1.1758, 1.17, 1.165​
 
The price of North American WTI Crude Oil is correcting within the uptrend around 93.32.

Since the beginning of the year, the United States has been actively trying to influence OPEC+, persuading it to increase oil production and thereby reduce fuel prices on the world market. Still, the cartel ignores these requirements, forcing the American authorities to reduce national strategic reserves to the lowest level since 1985 of 453.1M barrels. It, in turn, puts pressure on energy carriers: since the beginning of summer, prices have already fallen by more than 20 dollars, but yesterday, the alliance members again stressed that they could correct their dynamics with their intervention. Thus, the head of the Ministry of Energy of Saudi Arabia, Salman bin Abdul-Aziz Al Saud, confirmed that OPEC+ would begin developing a new agreement soon, under which the group intends to reduce production, which will normalize the current situation by reducing volatility. Also, the likely positive decision on the "nuclear deal" with Iran and the entry of cheap oil into the market remains a key factor. Thus, Saudi Arabia once again made it clear that the oil quotes and its supply are under full control, and in case of unforeseen circumstances, the organization is ready to intervene immediately.

Investors perceived this situation with a clear positive, and in the first two days of trading during the week, Crude Oil quotes increased by 8 dollars, reaching 93 again.

oil.png


On the weekly chart of the asset, the price left the limits of the local downwards channel, having consolidated above the resistance line. Technical indicators confirm the high probability of continued corrective growth: fast EMAs on the Alligator indicator began to actively approach the signal line, narrowing the range of fluctuations, and the AO oscillator histogram is forming new upward bars, approaching the transition level.

Resistance levels: 96, 102.37 | Support levels: 91.33, 85.3​
 
EURUSD - The euro against the dollar fell to a record low in 20 years

The EURUSD pair is actively declining, trading around 0.9957. This week, the instrument renewed its 20-year low, consolidating below 0.9950 on the back of continued growth in gas prices, recession risks in the EU, and negative macroeconomic statistics.

Thus, Services PMI in France fell to 51.0 points from 53.2 earlier, Services PMI in Germany fell to 48.2 points from 49.7 points earlier, and the aggregate value for all EU countries dropped to 50. 2 points from 51.2 a month earlier. Business activity in the French manufacturing sector fell to 49.0 points from 49.5 points earlier, in Germany – to 49.8 points, and in the EU – to 49.7 points, down 0.1 points.

By the end of yesterday, the situation changed, and the trading instrument stopped actively falling due to the decline in the US dollar, which began to sell off after the publication of disappointing data on new home sales in the US. Thus, in July, the indicator decreased to 511.0K from 585.0K in June, yielding the forecast of 575.0K. The total drop in sales was 12.6%, the lowest figure since February 2016. Seriously disappointed investors and business activity, which weakened to 44.1 points in the service sector and 51.3 points in the manufacturing sector.

eurusd.png


The trading instrument is moving within the global downward channel, falling towards the support line. Technical indicators maintain a stable sell signal: fast EMAs on the Alligator indicator are below the signal line, and the AO oscillator histogram forms downward bars, falling in the sell zone.

Resistance levels: 1.006, 1.0347 | Support levels: 0.9898, 0.9650​
 
XAUUSD - The price has stabilized but may resume a decline

The US dollar strengthened against alternative assets, including gold, amid problems in the European and Chinese economies. A serious increase in inflation in the EU and the UK, as well as a decrease in the volume of energy supplies to the EU and a slowdown in production growth in China against the backdrop of the introduction of quarantine measures, have seriously increased the risks of a global economic downturn and strengthened the dollar as a shelter asset. The US economy has so far been coping with the pressure of rising prices and tightening of the monetary policy of the US Federal Reserve, supported by a strong labor market, although several other industries, such as the construction sector, have begun to slow down. Experts hope the country will avoid a recession, despite the continued increase in rates, making the US currency more attractive for investment.

At the moment, the trading instrument has stabilized, as investors are waiting for the most important event of the week – the speech of the head of the US Federal Reserve, Jerome Powell, at the symposium in Jackson Hole. He is expected to confirm the need for further interest rate adjustments until inflation slows to a 2.0% target and oppose a slowdown in monetary tightening, strengthening the US currency. The slightest fluctuations regarding the continuation of the “hawkish” rate of the regulator may have the opposite effect, in which case the XAUUSD pair will resume growth.

gold.png


The trading instrument regained its lost position, having risen to 1750 (Murrey [4/8]), but for serious growth, it will need to consolidate above the middle line of Bollinger bands around 1769, and then the positive dynamics may continue to 1812.5 (Murrey [6/ 8]) and 1843.75 (Murrey [7/8]). If 1732 (lower line of Bollinger bands) is broken downwards, a new decrease to 1687.5 (Murrey [2/8]), 1656.25 (Murrey [1/8]) is possible.

Technical indicators do not give a single signal, illustrating the uncertainty of the market: Bollinger bands reverse horizontally, Stochastic is pointing upwards, and the MACD histogram is increasing in the negative zone.

Resistance levels: 1769, 1812.5, 1843.75 | Support levels: 1732, 1687.5, 1656.25​
 
USDJPY - Dollar is falling ahead of Jerome Powell's speech

Investors are in no hurry to open new trading positions in anticipation of the speech of US Federal Reserve Chairman Jerome Powell as part of the symposium starting today in Jackson Hole, hoping to get hints on further actions of the regulator in the field of monetary policy. To date, analysts estimate the likelihood of an interest rate hike in September by 50 basis points and by 75 basis points about the same. In addition, market participants hope that the Fed Chairman will comment on the prospects for tightening the existing parameters in the face of worsening forecasts for the energy crisis.

Macroeconomic statistics from Japan published today does not have a significant impact on the dynamics of the instrument. Meanwhile, Corporate Service Price Index corrected from 2.0% to 2.1% in July from a forecast of 2.2%, Foreign Bond Investment fell by 79.2 billion yen for the week ended August 19 after a record increase of 1154.7 billion yen over the previous period, and Foreign Investment in Japan Stocks for the same period fell from 45.3 billion yen to 28.5 billion yen.

usdjpy-1.png


The Ministry of Finance of Japan presented statistics on the level of oil purchases: last month, the country increased the transportation of "black gold" from Russia by 65.4% compared to the same period in 2021, and by 10% from the Middle East. However, Russian liquefied natural gas imports corrected downwards by 26.1%, and coal imports fell by 40.1%. Despite the fact that the rhetoric of the Japanese authorities is aimed at a phased reduction in the use of raw materials from the Russian Federation, official Tokyo announced the conclusion of contracts with the new operator of the Sakhalin-2 project, LLC Sakhalin Energy.

usdjpy-2.png


Bollinger Bands in D1 chart show moderate growth. The price range expands, freeing a path to new local highs for the "bulls". MACD tends to reverse into the descending plane preserving the previous buy signal (located above the signal line). Stochastic shows a more confident decline, testing the level of "80" for a breakdown. Current readings of the indicator signal in favor of a corrective decline in the ultra-short term.

Resistance levels: 137.5, 138.5, 139.5, 140.5 | Support levels: 136.5, 135.57, 134.54, 134​
 
GBPUSD - Traders are confident in the acceleration of the pace of rate hikes by the Bank of England

A regular meeting of the Bank of England is scheduled for September 15, at which the issue of further tightening monetary policy will be discussed. Judging by the dynamics of futures, traders expect an increase in interest rates to at least 75.0 basis points from the current 50 points, but a 100 basis point increase is not ruled out. These options became more actively discussed after the price of natural gas on the London Intercontinental Exchange reached 3.1 dollars per thousand cubic meters, which makes imports much more expensive and increases the burden on consumers.

The US dollar retreated somewhat from its highs and is trading at 108.600 in the USD Index. Investors reacted weakly to yesterday's data on durable goods orders, which remained in June, although basic orders rose slightly, adding 0.3%. The US housing market is still experiencing some difficulties, as evidenced by yesterday's data on the index of pending sales: the index fell by 1.0% in July, which indicates a large number of pending transactions.

gbpusd.png


The trading instrument is moving within the global downward channel, falling towards the support line. Technical indicators reversed and gave a sell signal: the range of fluctuations of the EMA on the Alligator indicator continues to expand in the direction of decline, and the histogram of the AO oscillator forms downward bars in the sell zone.

Resistance levels: 1.1883, 1.2219 | Support levels: 1.1717, 1.1452.​
 
The shares of Meta Platforms, which owns the world's largest social network Facebook, are falling around 174.

On the daily chart, a global downtrend continues to form, within which the price moves within a sideways corridor of 155 – 180 near its lower border. On the four-hour chart, there are currently no drivers for the growth of the trading instrument, and if the quotes consolidated below the year's low of 155.8, the asset might continue to decline to 135.2. In case of an upward movement, the nearest resistance is the initial correction of 23.6% Fibonacci around 201.

meta.png


Technical indicators confirm the likelihood of continuation of the current trend: fast EMAs on the Alligator indicator are below the signal line, and the AO oscillator histogram forms downward bars in the sell zone.​
 
The shares of PayPal, the American debit payment system, are correcting around 92.

On the daily chart, the price is above the resistance line of a wide downwards channel with dynamic boundaries at 55 – 85, however, a trend change is unlikely since an attempt to overcome the local high at the beginning of the month at 102 was unsuccessful.

On the four-hour chart, it is clearly seen that also to the rebound of quotes from the local high, the formation of the reversal Head and shoulders pattern with the Neck line at 90 has almost completed, which significantly increases the prospects for decline.

Technical indicators have weakened the buy signal: fast EMAs on the Alligator indicator are approaching the signal line, and the AO oscillator histogram is forming downward bars in the buying zone.

paypal.png
 
Back
Top