Solid ECN | Daily Technical | Video | Major Products

The shares of Bank of America, the largest financial conglomerate in the US, are moving within the corrective trend of around 34.

On the daily chart, the price has left the global downward channel with dynamic boundaries at 27 – 33 and is trying to stay within the corrective trend that began after overcoming the initial 23.6% Fibonacci correction at 34.7. On the four-hour chart, it is seen that the upward impulse has high prospects for implementation. However, they are relevant only after the quotes reconsolidation above 34.70.

bac.png


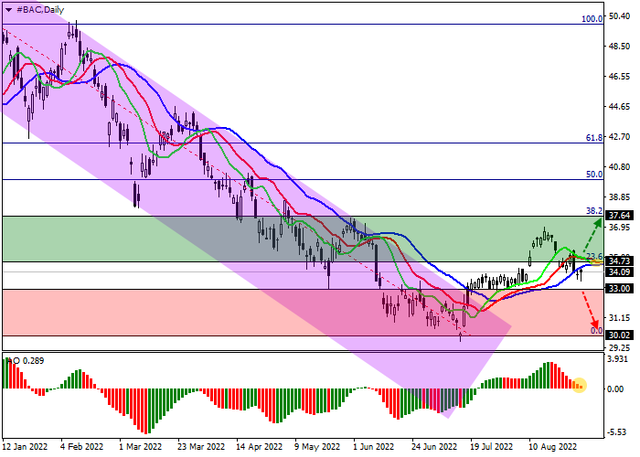
Technical indicators keep a buy signal: indicator Alligator’s EMA oscillation range is directed upwards, although it is narrowing, and the histogram of the AO oscillator forms downward bars in the buying zone.​
 
AUDUSD - Negative statistics from Australia put pressure on quotes

Australia's housing market data for July was released yesterday, with building permits falling sharply by 17.2% against a forecast of 5.0%, while construction of the rest of the property fell by a significant 43.5%, which was the second contraction in a row, and this allows us to speak about the negative impact of the increase in interest rates by the Reserve Bank of Australia (RBA), which began in May this year. The Q2 volume of completed construction works decreased by 3.8%, although analysts expected an increase of 0.9%, while the volume of issued building permits for the construction of private homes increased by 0.7% after falling by 1.8% a month earlier. Also to the construction sector, the negative dynamics continue in the lending sector: the rate of loans issued is actively declining, and in July, the overall increase corrected to 0.5% from 0.6% a month earlier, and for the private sector — the sector — to 0.7% from 0.9% on the back of increased cost of servicing loans due to a sharp increase in interest rates.

audusd.png


On the daily chart, the price is correcting, completing the formation of the Head and shoulders reversal pattern. Technical indicators have reversed and are holding a local sell signal: fast EMAs on the Alligator indicator cross the signal line downwards, and the AO oscillator histogram forms downward bars in the sell zone.

Resistance levels: 0.6928, 0.7122 | Support levels: 0.6847, 0.6681​
 
Crude Oil - decline after reports of continued supplies from Iraq

After a significant increase, quotes returned to levels below 100 and, according to leading experts, the downward dynamics are due to reports from the Iraqi State Oil Company (SOMO), which indicate the intention to continue continuous export of fuel, despite ongoing mass protests, which, in turn, weakened the fears of investors about the shortage of raw materials. European countries are currently called the key direction of supplies, and, according to SOMO, if buyers express interest, the company is ready to increase the volume of transportation of “black gold” to the region from 20% to 40%, for which the delegation has already gone to Germany for negotiations.

An additional pressure factor on the quotes was the statistics on stocks from the American Petroleum Institute (API), according to which the index rose by 0.593M barrels after falling by 5.632M a week earlier.

As for the demand for oil contracts from investors, last week, there were global changes: according to the US Commodity Futures Trading Commission (CFTC), the number of net speculative positions for the first time since the beginning of summer reached 246.2K, rising from 214.9K contracts a week earlier, which may be the primary sign of a change in the trend in the asset.

oil.png


On the daily chart of the asset, the trading instrument has left the limits of the local downwards channel, having overcome the resistance line. Technical indicators reversed upwards: fast EMAs of the Alligator indicator crossed the signal line upwards, and the AO oscillator histogram forms upward bars in the buying zone.

Resistance levels: 102.53, 111.97 | Support levels: 96.48, 91.16​
 
USDJPY - "bulls" are preparing to update the June high

Today, macroeconomic data that came out in Japan supported the quotes of the national currency. Industrial Production in July was 1.0%, exceeding the negative forecast of analysts at the level of -0.5%, while the volume of Retail Sales in annual terms for the same period was at the level of 2.4% against preliminary estimates of 1.9 %. Against this background, the USD/JPY pair fell to 138.30; however, the long-term trend remains upward.

Also today, Bank of Japan's board member Junko Nakagawa made a speech, based on whose statements it can be concluded that the regulator is still committed to maintaining the financial stimulus program to combat the consequences of the COVID-19 pandemic. According to the official, the regulator will be cautious in decisions on monetary policy, and its main task is not to interfere with the actively recovering economy.

Further dynamics of USDJPY will depend on macroeconomic statistics from the US coming this week. Market participants are waiting for the publication of data on Nonfarm Payrolls on Friday. Analysts suggest that the figure will add 300 thousand new jobs. If the actual value turns out to be close to the forecast or exceeds it, then the US dollar is waiting for further strengthening, and the USDJPY pair is likely to renew the June high around 139.2.

usdjpy-1.png


The long-term trend is upward. Yesterday, the instrument came as close as possible to the level of 139.2, in case of a breakout of which, the growth will continue with the targets of 141 and 142.5, and if it is held, a correction to the area of 136 – 135.3 will take place.

usdjpy-2.png


As part of the medium-term uptrend, the pair reached the target zone 2 (138.75–138.32). The "bulls" need to consolidate above this area, and then the next target of the upward movement will be the target zone 3 (143.11–142.67). The key trend support is shifting to the levels of 134.94–134.54. If it is tested as part of a correction, traders should consider new long positions in the asset.

Resistance levels: 139.2, 141, 142.55 | Support levels: 136, 135.3, 132.2​
 
XAUUSD - demand for gold is falling again

Due to the strengthening of the USD Index to the high of the year at 109, the XAUUSD pair is correcting in a downtrend around 1705.

The reason for the positive dynamics of the US dollar was several factors, the key among which was the speech of the head of the US Federal Reserve, Jerome Powell, at the symposium in Jackson Hole. The official gave the markets a clear signal that the regulator will continue to raise interest rates until inflation is brought under control, after which the rate will be kept at a “stable level” for some time to consolidate the effect of the measures already taken. According to him, the restoration of price stability will require a decisive use of central bank instruments, so experts suggest that at the September meeting, the US Federal Reserve will raise interest rates by 75,0 basis points for the third time in a row. However, yesterday, the head of the Federal Reserve Bank of New York, John Williams, noted that the optimal level of the indicator is 3.5%, which hints at a possible adjustment immediately by 1.00%. A sharp rise in value is always a negative sign for gold.

Serious changes continue in demand for the metal from investors. According to the latest report from the US Commodity Futures Trading Commission (CFTC), last week, net speculative positions in the asset decreased to 125.8K from 141.2K contracts. If we pay attention to the activity of traders, then the sellers held the lead in cash-backed contracts, reducing them by 2,739K positions, while buyers liquidated only 99 contracts.

gold.png


On the daily chart of the asset, the trading instrument stays within the global downwards channel with dynamic boundaries 1770.0–1630.0. Technical indicators strengthen the sell signal: fast EMAs on the Alligator indicator are kept well below the signal line, and the AO oscillator histogram continues to fall in the sell zone.

Resistance levels: 1721, 1770 | Support levels: 1696, 1650​
 
USDCAD - Candlestick Analysis

H4

On the 4-hour chart in the ascending trend channel below the level of 1.3207 there is a formation of a Hanging Man candlestick analysis pattern, signaling an impending price reversal, as well as two Shooting Star patterns, indicating weakening buyer activity. At the moment, above the level of 1.3089, a Three Black Crows figure has appeared, which similarly emphasizes the "bearish" sentiment for the instrument. The most likely is the decline of the asset to the zone of 1.2732–1.2454 after overcoming the lower boundary of the uptrend and the support level 1.3029. An alternative scenario is possible if the price consolidates above the resistance level of 1.3267 with the targets of 1.3425 – 1.3716.

usdcad-1.png


D1
On the daily chart at the level of 1.3207 there is a Shooting Star pattern, which is a reversal pattern at the top, as well as the formation of a Hanging Man confirming pattern, which appears in the area of high prices and signals that the asset has reached a local top. In this case, a downward scenario from the support level of 1.3029 seems more likely, and consolidation of the price below it will allow the "bears" to head to the zone of 1.2732–1.2454.

usdcad-2.png


Support levels: 1.3029, 1.2732, 1.2454 | Resistance levels: 1.3267, 1.3425, 1.3716​
 
XAUUSD - demand for physical gold declined sharply

According to the reports of the world's leading mints, primarily the US, August was the weakest month of this year in terms of sales of the precious metal: the US Mint sold 46,000K ounces of gold in the form of the American Eagle coin, which is 28% lower than in July and 66% down from August 2021 and American Buffalo coin sales were 17,500K ounces, down from 39,500K ounces in July.

Another worrying factor for the asset is the outflow of investors from ETFs. Thus, over the past week, metal stocks at the SPDR Gold Shares (GLD) trust decreased by 11 tons, demonstrating negative dynamics for the tenth consecutive week, while net capital outflow in August was recorded at 456.0M dollars. Data from trading floors also confirm these changes in investment demand: according to the latest report from the US Commodity Futures Trading Commission (CFTC), last week, the number of net speculative positions in gold decreased to 117.7K from 125.8K contracts. If you pay attention to the dynamics of trading, it is "bulls" that close more deals, which can serve as short-term support for quotes: last week, swap dealers liquidated sell positions by 5,296K, and buyers increased by 1,755K contracts.

gold.png


On the daily chart of the asset, the price is moving within a downward channel and, after reaching the low of the year, is preparing for a local reversal. Technical indicators maintain a sell signal, ignoring a possible local correction: fast EMAs on the Alligator indicator are kept well below the signal line, and the AO oscillator histogram is decreasing in the sell zone.

Resistance levels: 1727, 1802 | Support levels: 1696, 1640​
 
Crude Oil - growth ahead of OPEC+ meeting

Quotes of Brent Crude Oil are trading around 95, and the asset's volatility is very high ahead of the meeting of representatives of the Organization of the Petroleum Exporting Countries.

Last week, the key event was the decision of the G7 countries to introduce new restrictions on the supply of Russian oil: it is supposed to set a price ceiling for raw materials and prohibit the insurance of ships transporting them at a higher cost. Deputy Chairman of the Russian government, Alexander Novak, has already stated that official Moscow will not sell energy resources to those states that use non-market pricing schemes and intends to reorient itself to other regions. Thus, this decision will have almost no effect on the volume of exports of Russian oil in the world, and pressure on energy prices will be minimal.

Today at 12:00 (GMT+2), the leaders of the OPEC+ countries will discuss the parameters for implementing the oil production agreement for the period from October to the end of this year. According to preliminary information, the cartel intends to maintain the current agreements on a gradual increase in production by 100K barrels per day, which is another positive factor for the market. At least Deputy Prime Minister of the Russian Federation Alexander Novak and Minister of Energy of Saudi Arabia Prince Abdulaziz bin Salman have already spoken about this.

oil.png


On the daily chart of the asset, the trading instrument is moving within a downward correction to the global uptrend, and after reaching the July low at 91.00, it is reversing upwards. Technical indicators slowed the decline: indicator Alligator's EMA oscillation range began to narrow, and the histogram of the AO oscillator was close to the transition level.

Resistance levels: 97.26, 103.5 | Support levels: 91.48, 85.6​
 
S&P 500 - Growth in the US bond market is a catalyst for the correction of the index

The US stock market continues to trade in a downtrend, despite the positive corporate reporting. Quotes of the S&P 500 index are currently correcting downwards to the area of 3926.

American automaker Ford Motor Co. reported an increase in sales in August by 27.3% compared to the same period a year earlier, while the total number of cars sold was fixed at around 158.088 thousand vehicles. The same figure for electric vehicles quadrupled to 5.9 thousand cars. The day before, the developer of semiconductor products Broadcom Inc. published its financial results, reporting a 1.7-fold increase in net profit. The company posted 8.46 billion dollars in revenue, beating analysts' estimate of 8.41 billion dollars, and posted earnings per share of 9.73 dollars.

spx.png


The index quotes fell below the support line of the local uptrend, trying to consolidate in the downtrend. Technical indicators are holding a sell signal, which they have issued recently: fast EMAs on the Alligator indicator are moving away from the signal line, and the AO oscillator histogram, holding in the sell zone, is forming descending bars.

Support levels: 3878, 3641 | Resistance levels: 3992, 4180​
 
The second largest cryptocurrency by capitalization, ETH, is trading within a correction to the recent significant decline, consolidating around 1644.

ETHUSD, H4

The four-hour chart of the asset shows that the downward movement is developing within the framework of a possible Step pattern, where the second and last step has almost completed their formation. According to the implementation theory, in this case, the current global trend will continue, and the key support for the price will be the initial Fibonacci 23.6% correction at 1517, the breakdown of which will open the way for quotes to the 1252 area.

eth-1.png


ETHUSD, D1
On the daily chart, a corrective upward wave is forming, which has recently consolidated below the support line of the local Flag pattern around 1660. The key support at the initial correction of 23.6% Fibonacci around 1517 has not yet been broken, which allows traders to hope to hold their positions at the current values for some time.

Technical indicators maintain a global sell signal, ignoring the local correction: fast EMAs on the Alligator indicator are below the signal line, and the AO oscillator histogram is in the negative zone.

eth-2.png


Resistance levels: 1900, 2200 | Support levels: 1517, 1252​
 
Back
Top