Solid ECN | Daily Technical | Video | Major Products

BTC USD - short-term price correction possible

The main driver of positive dynamics was the July data on US inflation: a slowdown in its growth to 8.5% made many investors hope that the peak of consumer price growth in the country has passed, and the indicator will now begin to move towards the target level of 2.0%, which may force the US Federal Reserve to abandon a sharp rate hike of 75 or 100 percentage points at the next meetings. It, in turn, became a catalyst for the active decline of the dollar against its main competitors. Also, the transition of the Ethereum network to the Proof-of-Stake (PoS) proof algorithm, scheduled for mid-September, arouses the interest of traders in the entire cryptocurrency market and “digital gold” in particular.

btcusd.png


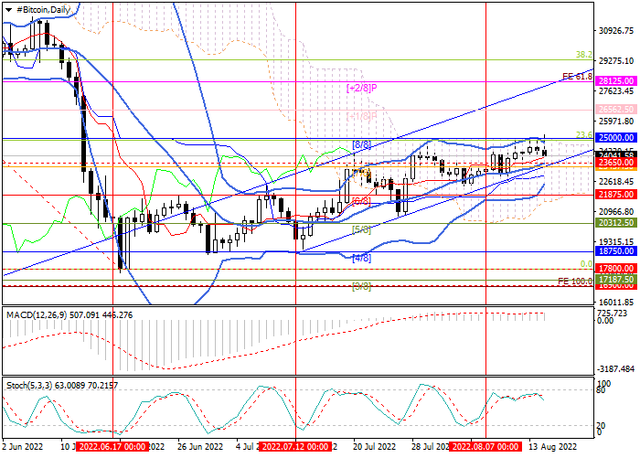
The price has rolled back down and not consolidated above 25000. Judging by the reversal of Stochastic near the overbought zone, the decline may continue to the middle line of Bollinger bands around 23650, and in case the quotes consolidate below it and 23437.5, return to 21875. Otherwise, growth will resume towards 25000, 26562.5, and 28125.

Resistance levels: 25000, 26562.5, 28125 | Support levels: 23437.5, 21875, 20312​
 
NZDUSD - Technical analysis

On the four-hour chart, at the resistance level of 0.6453, there is the formation of an Evening Doji Star reversal candlestick pattern, as well as a Three Black Crows pattern, which included a Bear Marubozu candlestick. The combination of these figures indicates pressure on the price from sellers and indicates a continuation of the downtrend with the target of 0.6279, overcoming which will allow the "bears" to continue moving to the area of 0.6107–0.5944. An alternative scenario can be realized if the quotes consolidate above 0.6453; then the asset will be able to restore its positions in the range of 0.6598–0.6748.

nzdusd-1.png

After the uptrend on the daily chart at the level of 0.6453, a Bearish Harami candlestick pattern appeared, which signals an imminent price reversal, and there is also a red long Engulfing reversal candle, warning the "bulls" of the upcoming trend change. In this situation, it is more likely that the quotes will fall to the support level of 0.6279, consolidation below which will allow the "bears" to head to the area of 0.5944.

Support levels: 0.6279, 0.6107, 0.5944 | Resistance levels: 0.6453, 0.6598, 0.6748

nzdusd-2.png
 
USDJPY - Technical analysis

H4

On the four-hour chart, the quotes of USDJPY are moving in an uptrend channel. After a false breakout of its lower border at the level of 132.54, a Hammer reversal pattern is formed. Next, a Three Advancing White Soldiers pattern was formed, signaling the continuation of the uptrend; however, the emerging Long-Legged Doji pattern warns market participants about the existing uncertainty and signals a possible downward reversal. In this situation, a likely scenario may be a decrease in the quotes of the trading instrument to the support level of 132.54, consolidation of the price below which will allow the "bears" to go lower, to the area of 130.45–126.78. An alternative scenario can be realized if the price consolidates above the resistance level of 135.39. Then the quotes may recover to the range of 136.85 – 139.46.

usdjpy-1.png


D1
On the daily chart, at the resistance level of 135.39, there is the formation of a Tower Top candlestick analysis pattern, which is formed in the area of high prices and is a downward reversal pattern. At the moment, the price is moving in an uptrend; however, a possible scenario could be that it overcomes the lower border of the trend channel and consolidates below the level of 132.54, which will strengthen the downtrend to the area of 130.45 – 126.78.

Support levels: 132.54, 130.45, 126.78 | Resistance levels: 135.39, 136.85, 139.46

usdjpy-2.png
 
EURUSD - Rising gas prices put pressure on the euro

Since the beginning of the week, the European currency continues its downtrend, under pressure from rising natural gas prices and weak macroeconomic statistics. Now the quotes of the EURUSD pair are in a corrective trend, trading around 1.0182.

Earlier, the governments of the eurozone countries adopted a resolution under which they will voluntarily reduce gas consumption by 15% until the end of March next year in order to reduce fuel shortages due to supply restrictions from Russia. Against the background of this decision, the prices for "blue fuel" are showing a sharp increase, at the moment reaching record March levels in the region of 2.6 thousand euros per 1.0 thousand cubic meters. In turn, macroeconomic statistics turned out to be quite weak: the August ZEW Survey on Current Situation in Germany fell to –47.6 points, and ZEW Economic Sentiment was –55.3 points, while the same indicator in the eurozone adjusted to –54.9 points from –51.1 points a month earlier.

eurusd.png


The EURUSD pair is holding within the global downward channel, reversing to the downside again. Technical indicators, having reversed in the direction of growth, once again gave a signal to sell. The fast Alligator indicator EMAs crossed the signal line from above, and the histogram of the AO oscillator is forming descending bars approaching the transition level.

Support levels: 1.0111, 0.9951 | Resistance levels: 1.0260, 1.0406​
 
USDCAD - Technical analysis

H4

On the four-hour chart, a Bullish Flag price pattern is forming, the completion of which is expected above the resistance level of 1.2960, since the breakout of its upper border was carried out by impulsive green candles in the form of a Three Advancing White Soldiers pattern. However, the movement slowed down with the appearance of a Hanging Man reversal candlestick pattern below the level of 1.2960, which is observed in the area of prevailing "bullish" activity. Therefore, to confirm a reversal at the local top, the formation of other "bearish" signals is required. Since the asset continued to grow after the formation of this pattern, one can assume that the quotes will continue their uptrend or consolidation in a narrow range of 1.2900–1.2960. If the "bulls" manage to successfully overcome the level of 1.2960 and consolidate above it, one should expect the quotes to continue moving towards the area of 1.3228–1.3630. An alternative scenario is possible in case of overcoming the support level of 1.2762 by the "bears". Then the negative dynamics may intensify up to the level of 1.2295.

usdcad-1.png


D1
On the daily chart, there is a Falling Wedge price pattern. At the moment, it is clear that the price has broken through its upper limit, but confirmation of this has not yet been received. In addition, at the support level of 1.2762, one of the varieties of the Morning Star candlestick pattern has formed, which indicates the prevailing "bullish" sentiment. In case of successful testing of the broken level and fixing the price above 1.2960, the quotes will most likely go higher, to the area of 1.3228–1.3630.

Support levels: 1.2762, 1.2534, 1.2295 | Resistance levels: 1.296, 1.3228, 1.363

usdcad-2.png
 

AUDUSD - Technical analysis


H4
On the four-hour chart, under the resistance level of 0.7030, a Three Black Crows candlestick analysis pattern was formed, after which the trading instrument showed a decrease to the area of 0.6912. In addition, the Bear Marubozu pattern was included in this model, emphasizing the predominance of sellers. Currently, quotes have formed a Hanging Man figure, which in this situation may mean a continuation of the downtrend. A likely scenario is a decline to the support level of 0.6862, overcoming which will allow the "bears" to go lower, to the levels of 0.6680, 0.6420. An alternative scenario can be realized if the "bulls" hold their positions and the quotes recover to the resistance level: a breakout of the key level of 0.7030 will open the way for buyers to the range of 0.7184–0.7400.

audusd-1.png


D1
On the daily chart, under the resistance level of 0.7184, a reversal candlestick pattern Evening Doji Star is observed, after which the asset began to decline down to the level of 0.6912. This pattern is a strong signal to alert traders to declining long positions, giving the "bears" an opportunity to correct the price down. A more likely scenario at the moment is a downtrend towards the key support level of 0.6862. A breakdown of this level will mean the final weakening of the "bulls", which will strengthen the downtrend of the instrument to the zone of 0.6680–0.6420.

Support levels: 0.6862, 0.668, 0.642 | Resistance levels: 0.7030, 0.7184, 0.74

audusd-2.png
 
The EURUSD pair is trading in a downtrend, currently at 1.003.

On the daily chart of the asset, the price is falling within the global corridor with dynamic boundaries 1.024 – 0.97, getting ready to test the key historical support around 1. The four-hour chart shows that the potential for a downward movement is quite high, and the nearest solid support for the trading instrument can only be the initial trend of 61.8% of the Fibonacci extension around 0.9814. If the quotes fix below it, the downward dynamics may continue up to the basic trend of 100.0% on the Fibonacci extension around 0.9494.

eurusd.png


Technical indicators keep a sell signal: indicator Alligator's EMA oscillation range expands downwards, and the AO oscillator histogram forms downward bars in the sell zone.​
 
AUDUSD, H4
On the four-hour chart, above the level of 0.6846, there is a formation of a Hammer candlestick pattern, which may warn market participants that the asset is in the area of low prices and will soon begin to unfold. In addition, a Doji pattern was formed, signaling the uncertainty in the market and the equality of the forces of "bulls" and "bears". This pattern usually indicates reversals in the instrument; however, it requires additional "bullish" confirmation in the local basis. Thus, at the moment, it is most likely that the quotes of the AUD/USD pair will fall to the support level of 0.6846, overcoming which will open the way for the "bears" to the zone of 0.6680 – 0.6401. An alternative scenario is possible after fixing the quotes of the trading instrument above the resistance level of 0.7031 with the targets at 0.7184 – 0.7392.

audusd-1.png


AUDUSD, D1
On the daily chart, there is the formation of a Bear Marubozu candlestick analysis pattern, which emphasizes the strength of sellers, as well as the formation of a Three Black Crows figure under the resistance level of 0.7031, which also signals a continuation of the downtrend. Currently, the asset is most likely forming a Falling Three Methods pattern, which is a continuation of the trend and warns that quotes may continue to move down. More likely is a scenario with a downtrend to the level of 0.6846, the overcoming of which will allow sellers to strengthen the movement up to the level of 0.6401.

Support levels: 0.6846, 0.6680, 0.6401 | Resistance levels: 0.7031, 0.7184, 0.7392

audusd-2.png
 
The USDJPY pair is trading around 137.15.

On the daily chart of the asset, the price is correcting as part of a global uptrend, the deceleration stage of which increasingly resembles a global Head and shoulders reversal pattern with a Neckline around 132.78. On the four-hour chart, it can be seen that the potential for the development of a downward movement, in this case, will be quite high but to confirm the implementation of the pattern, the quotes of the trading instrument need to reverse from the current prices and not overcome the annual high of 139.35.

usdjpy.png


Technical indicators keep a buy signal: the range of fluctuations of the EMA on the Alligator indicator is expanding upwards, and the histogram of the AO oscillator has formed the first rising bar after moving into the buy zone.​
 
The XAGUSD pair continues its local corrective trend and is now around 18.94.

On the daily chart of the asset, the price of the precious metal is declining within the global downward channel with dynamic boundaries at 20 – 16. After reaching the resistance line at 20.9, the trading instrument reversed and formed another wave of decline. The target could be the global support level of 16.68. On the four-hour chart, the downside potential looks quite high, and if the quotes consolidate below the initial trend level of 61.8% on the Fibonacci extension, which coincides with the low of the year at 18.31, there will be no serious support for the price, and the position can be realized.

silver.png


Technical indicators reversed and gave a sell signal: the range of EMA fluctuations on the Alligator indicator is expanding downwards, and the AO oscillator histogram has formed the first downward bar after moving into the sell zone.​
 
Back
Top