Solid ECN | Daily Technical | Video | Major Products

Gold price resumes the bullish trend

Gold price ended yesterday above 1810 level, to open the way to achieve more gains in the upcoming sessions, as it resumes the main bullish trend within the bullish channel that has positive targets that start at 1838.1 and extend to 1900. Therefore, we expect to witness more rise on the intraday and short term basis, noting that breaking 1810 will stop the positive scenario and press on the price to test the bullish channel’s support line around 1784.50 before any new attempt to rise.

gold.png


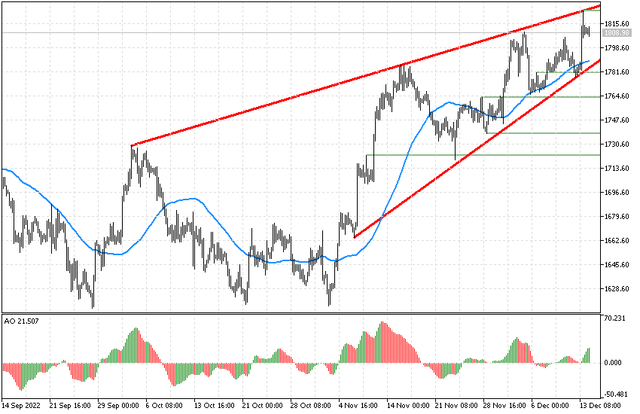
The expected trading range for today is between 1795 support and 1835 resistance.​
 
Crude oil price faces solid resistance

Crude oil price’s rally stopped at 75.63, which formed solid resistance against the price, accompanied by witnessing overbought signals through stochastic that might press on the price to rebound bearishly, while the EMA50 supports the price positively.

oil.png


Therefore, the contradiction between the technical factors makes us prefer to stay aside until we get clearer signal for the next trend, noting that breaching 75.63 will lead the price to achieve additional bullish correction that its next target reaches 78.93, while breaking 74.85 will put the price under negative pressure that its targets begin by testing 74.05 followed by 72.60 levels.

The expected trading range for today is between 73.80 support and 77.30 resistance.​
 
USDCAD Completes Negative Pattern

The USDCAD pair traded with strong negativity yesterday to break 1.3570 and complete forming double top pattern that its signs appear on the chart, reinforcing the expectations of continuing the bearish trend that its targets begin at 1.3500 and extend to 1.3445 after surpassing the previous level. Therefore, we will continue to suggest the bearish trend for the upcoming period, noting that breaching 1.3570 might push the price to achieve intraday gains and test 1.3680 areas again before any new attempt to decline.

uscad.png


The expected trading range for today is between 1.3480 support and 1.3630 resistance.​
 
EURUSD continues to achieve gains

The EURUSD pair provided more bullish bias to approach 1.0700 barrier, waiting for more rise to test 1.0745 level that represents our next main target, organized inside the bullish channel that supports the chances of surpassing the mentioned level and achieve more gains on the intraday and short term basis. Therefore, we will continue to suggest the bullish trend for the upcoming period supported by the EMA50, noting that breaking 1.0595 might press on the price to test the key support 1.0515 before any new attempt to rise.

eurusd.png


The expected trading range for today is between 1.0590 support and 1.0750 resistance.​
 
GBPUSD Awaits more Rise

The GBPUSD pair fluctuates with slight negativity now, affected by stochastic negativity, while the EMA50 continues to support the bullish wave, organized inside the bullish channels that appear on the chart, waiting to resume the bullish bias to visit 1.2550 as a next target. Therefore, we should note that breaking 1.2325 will stop the positive scenario and press on the price to start intraday bearish correction.

gbpusd.png


The expected trading range for today is between 1.2300 support and 1.2490 resistance.​
 
USDCAD - Growth within the local ascending corridor

The quotations were practically not affected by the report of Statistics Canada: in October, the volume of production grew by 2.8% to 72.6B Canadian dollars, and the oil industry (12.7%) and the food industry (2.9%) stand out among the leaders of the sector and the chemical industry (4.9%), while in the automotive industry (–3.2%) and mechanical engineering (–1.7%), a negative trend is observed. According to experts, growth in these sectors should not be expected soon, as there is a serious shortage of materials and microchips, which also reduced production and decreased exports of cars and spare parts by 1.8%.

usdcad.png


On the daily chart of the asset, the trading instrument moves within the local ascending corridor. Technical indicators signal further growth.

Resistance levels: 1.37, 1.39 | Support levels: 1.354, 1.338​
 

EURUSD under the negative pressure​

The EURUSD pair traded negatively in the previous sessions to break the bullish channel’s support line and settles below it, but we notice that the EMA50 forms good support to protect the price from suffering more losses, accompanied by witnessing positive signals through stochastic, which supports the chances of regaining the bullish trend again. Therefore, we believe that the chances valid to trade positively today, and the targets begin by surpassing 1.0650 to ease the mission of heading towards 1.0745, noting that breaking 1.0580 will stop the expected rise and press on the price to test 1.0515 direct.

eurusd.png


The expected trading range for today is between 1.0540 support and 1.0710 resistance.​
 
BTCUSD - US Federal Reserve decisions continue to put pressure on the position of "digital gold"

Monetary factors are still the main drivers of the quotes movement. The initial positive dynamics were associated with the release of November statistics on US inflation, which recorded a slowdown in consumer price growth in the country for the second month in a row and strengthened investors' hopes that the US Federal Reserve would soften its "hawkish" rhetoric. Still, the results of the regulator's meeting on Wednesday disappointed the market. Officials expectedly adjusted the rate of the interest rate hike from 75.0 bps to 50.0 bps to 4.50% but said that the problem of high inflation has not yet been resolved, and monetary tightening should be continued. At the same time, experts in the department predicted a decrease in the indicator no earlier than 2024. Similar statements were made by representatives of the European Central Bank (ECB) and the Bank of England, putting even more pressure on digital assets.

btc.png


The trading instrument is at 16750 and may continue to decline around the November lows at 15700, 15000 (Murrey [4/8]). The key "bullish" seems to be the resistance zone 17500 – 17830 (Murrey [6/8], Fibonacci correction 23.6%). If it is broken, quotes may rise to 19100 (Fibonacci correction 38.2%) and 20000 (Murrey [8] /8], Fibonacci retracement 50.0%).

Resistance levels: 17830, 19100, 20000 | Support levels: 15700, 15000, 13750​
 
ETHUSD - Technical analysis

Since the end of last month, the quotes have been moving in the main sideways range of 1325.00–1090.00. The cryptocurrency market is uncertain, as fears of further negative consequences of the bankruptcy of the FTX exchange are holding back the start of corrective growth. However, in the short term, it will become possible if the consolidation above 1250.00 (Murrey level [2/8], the middle line of Bollinger bands) to the levels 1325.00 or 1500.00 (Murrey level [4/8], the upper limit of the long-term downward channel). The key "bearish" level is 1090.00, consolidation below, which will give the prospect of further decline to 1000.00 (Murrey level [0/8]), 875.00 (Murrey level [–1/8]).

eth.png


Resistance levels: 1250, 1325, 1500 | Support levels: 1090, 1000, 875​
 
EURUSD - Low gas price in the EU supports the euro

Thus, according to data from the TTF exchange, the price for gas contracts with delivery in February is now 1120.0 dollars per 1.0K cubic meters, which was last observed in June, when the Nord Stream gas pipeline maintained maximum pumping levels. The current low quotations provide an opportunity for countries in the region to conclude long-term deals for supplies in the spring, as the storage facilities are almost full now. Meanwhile, in November, the German producer price index lost 3.9%, which led to a slowdown in growth to 28.2% YoY from 34.5% earlier.

eurusd.png


On the daily chart, the trading instrument continues its corrective growth and confidently holds in the local ascending corridor. Technical indicators point to continued growth.

Resistance levels: 1.0675, 1.09 | Support levels: 1.0525, 1.032​
 
Back
Top