Tifia Forex Broker Daily Market Analytics, Analytics and trading recommendations by Tifia Company

XAU/USD: demand for gold will be supported as for an asset-shelter

15/06/2018

Current dynamics


Despite the decision of the Fed to raise the rate and a statement of intent to further tighten monetary policy in the US, gold prices on Thursday reached the highest level for the month near the mark of 1309.00 dollars per ounce.

Investors once again remembered geopolitical tensions and the threat of a large-scale world trade war.

President of the United States Donald Trump approved the introduction of duties on the import of goods from China worth about 50 billion dollars.

On Thursday, high-ranking representatives of the White House, officials responsible for state security, representatives of the Ministry of Finance and the US Department of Commerce held a 90-minute meeting. On Friday, the US Trade Mission intends to make public the list of goods for which duties will be distributed.

Trump does not intend to back away from taking the course to support local producers and pursuing a protectionist policy towards American goods abroad.

As you know, from June 1, the US began to apply import duties on steel and aluminum from China, the EU, and Canada. Other countries, suppliers of these goods to the United States, were sanctioned in March.

June gold futures on COMEX closed on Thursday with an increase of 0.6%, at USD 1304.00 per troy ounce, which is the maximum closing level since May 14.

US President Donald Trump's administration announced plans to introduce import duties on Chinese goods worth tens of billions of dollars in the next few days, which led traders to prepare for a new wave of geopolitical tensions.

As you know, in the context of an increase in the interest rate, the price of gold is falling, because it is more difficult for him to compete with other objects for long-term investments that generate revenue, such as, for example, government bonds. At the same time, the investment attractiveness of the dollar is growing.

In periods of aggravation of the geopolitical situation or international trade contradictions, the "swing" moves in the opposite direction and the demand for gold rises again, as investors see it as an safe-asset.

Nevertheless, despite the growth, prices in the future will face resistance of sellers of gold in favor of the dollar against the background of further tightening of the monetary policy of the Fed.

Only weak macro data from the United States, as well as an even greater strengthening of geopolitical tensions in the world, can push gold quotes higher. So far, negative dynamics prevails.

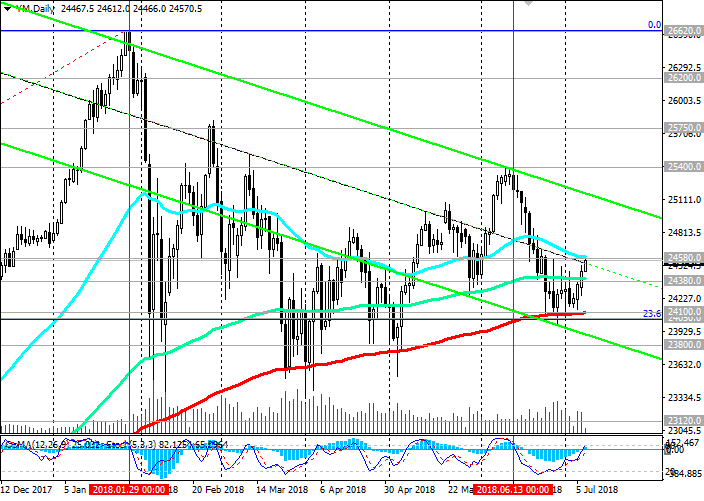
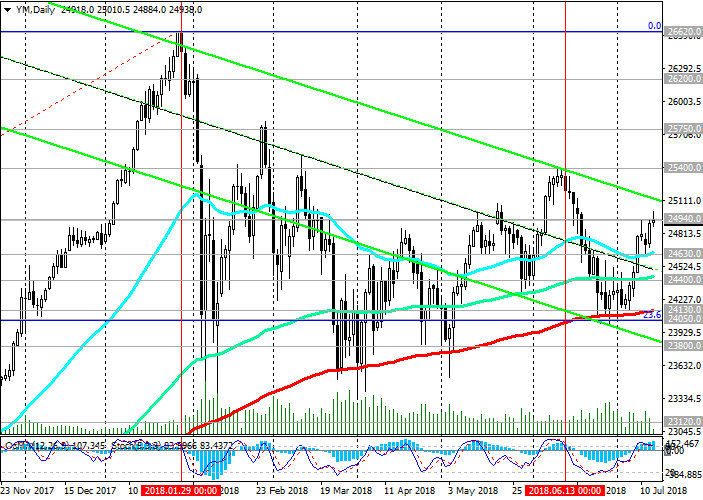
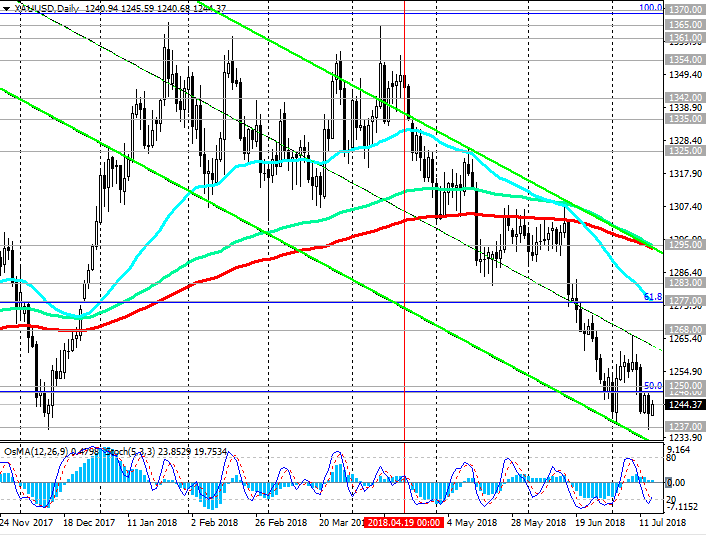
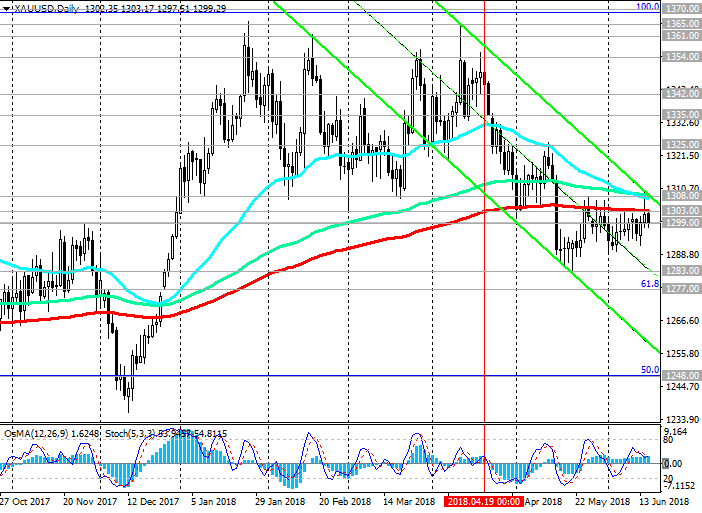
Level 1303.00 (EMA200 on the daily chart) is still a strong resistance for the XAU / USD pair.

*)An advanced fundamental analysis is available on the Tifia Forex Broker website at tifia.com/analytics


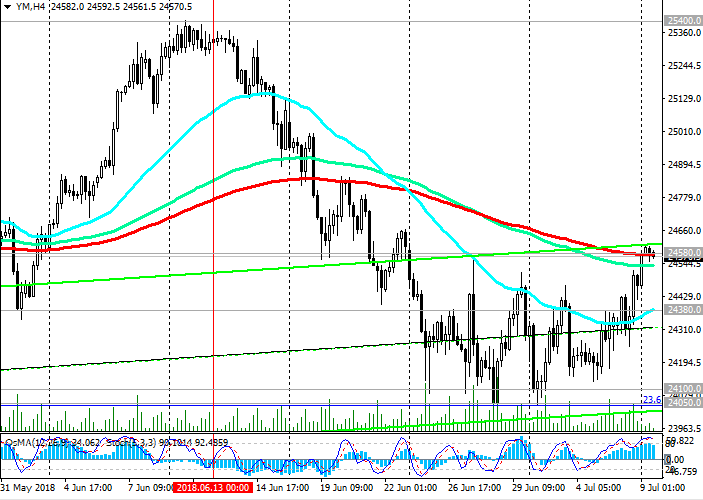
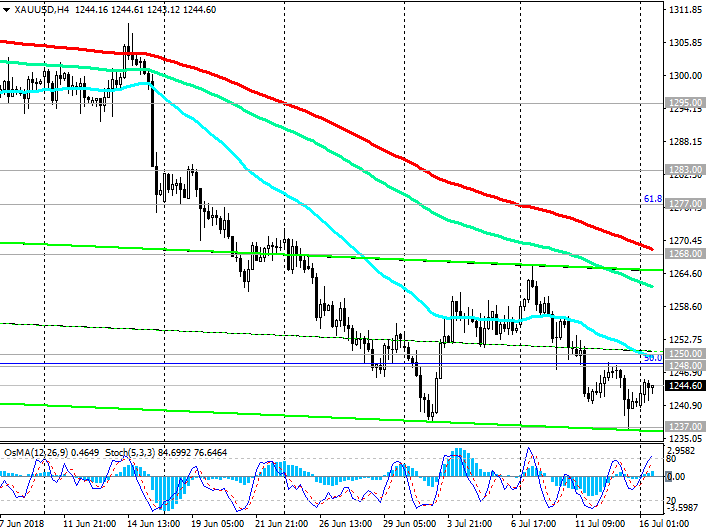
Support levels: 1299.00, 1283.00, 1277.00, 1248.00

Resistance levels: 1308.00, 1325.00, 1335.00, 1342.00, 1354.00, 1361.00, 1365.00
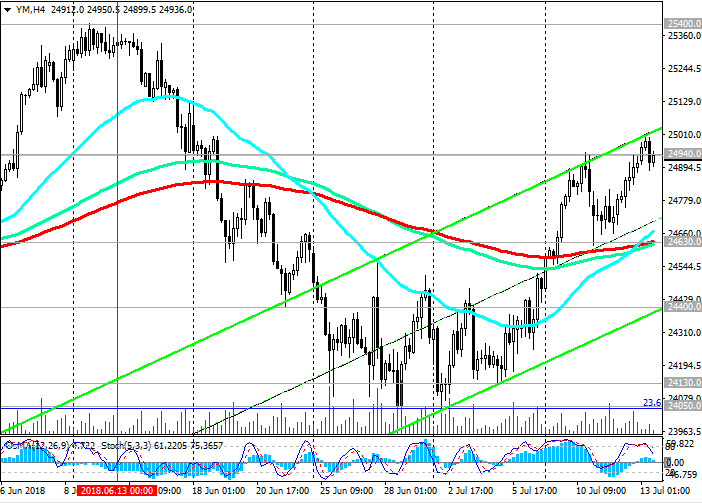
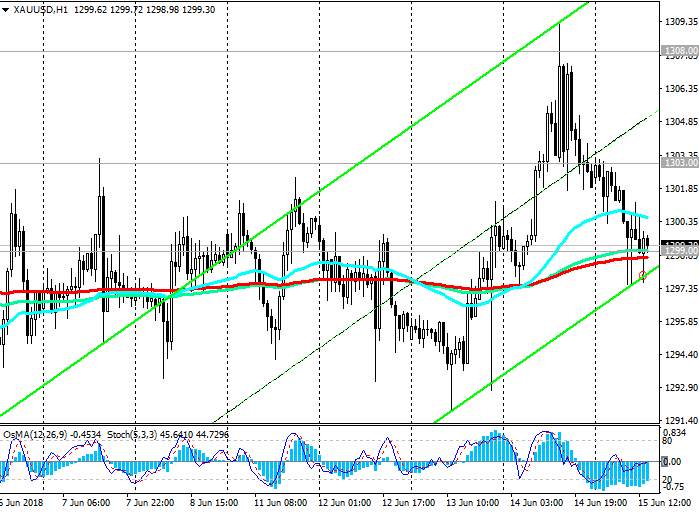

Trading Scenarios


Sell in the market. Stop-Loss 1309.00. Take-Profit 1290.00, 1283.00, 1277.00, 1270.00, 1248.00

Buy Stop 1309.00. Stop-Loss 1298.00. Take-Profit 1325.00, 1335.00, 1342.00, 1354.00, 1361.00, 1365.00


150618-_XU-_D.png


150618-_XU-_H1.png


*) For up-to-date and detailed analytics and news on the forex market visit Tifia Forex Broker website tifia.com
 
AUD/USD: amid escalation of trade contradictions

18/06/2018


Current dynamics


As you know, President Donald Trump on Friday approved a 25% import duty on Chinese goods worth $ 50 billion. After that, representatives of the Chinese authorities said that they would introduce reciprocal tariffs of the same scale on American goods.

World stock markets and commodity currencies are declining at the beginning of a new week. The aggravation of trade disagreements between the US and China negatively affects the demand of investors for risky assets.

Prices for raw materials also fall in the face of aggravation of trade contradictions, which leads to a decrease in the quotations of commodity currencies relative to the dollar.

The situation can lead to a trade war between the two largest economies in the world.

China is Australia's largest trade and economic partner. Negative information on the Chinese economy leads, as a rule, to a decrease in the quotations of the Australian dollar.

China is also the largest buyer of primary commodities in Australia, primarily iron ore, so necessary for China's industrial potential.

Concerns about the fate of the North American Free Trade Area (NAFTA) and the fees that the Trump administration imposed on the European allies also increase concerns in the markets.

In this situation, the demand for the US dollar, which plays the role of refuge in this situation, is growing.

Also, the decision of last week's Fed meeting contributed to the growth of the dollar, following which the Fed raised the target range of interest rates by 0.25% to 1.75% - 2.00% on Wednesday, and also signaled the possible acceleration of the rate of monetary tightening policy this year to maintain a sustainable recovery of the country's economy.

On Tuesday (01:30 GMT) the protocol from the recent meeting of the RBA, at which the bank kept the current monetary policy at the same level, will be published.

Also at the same time (01:30 GMT) on Tuesday housing price indices in Australia (for 1 quarter) will be published. The RBA is positively considering the slowdown in housing prices.

At the same time, market participants believe that the RBA will not raise interest rates until mid-2019. Salaries continue to grow slowly, and households' debt has risen to a record high, which also includes raising interest rates to a more distant future.

According to the head of the RBA Philip Lowe, "there are no serious arguments in favor of tightening monetary policy in the short term". In his opinion, "before the rate increases, some time will pass".

In any case, on Tuesday, at the time of the publication of the minutes of the RBA meeting and the Australian housing price index, volatility in the Australian currency trading is expected to grow.

At the same time, the different focus of the monetary policies of the Fed and the RBA remains the main argument in favor of further weakening of the AUD / USD.

*)An advanced fundamental analysis is available on the Tifia Forex Broker website at tifia.com/analytics


Support levels: 0.7410, 0.7330, 0.7270, 0.7155

Resistance level: 0.7500, 0.7575, 0.7680, 0.7820, 0.7900, 0.8000


Trading Scenarios


Sell in the market. Stop-Loss 0.7490. Take-Profit 0.7410, 0.7330, 0.7270, 0.7155

Buy Stop 0.7510. Stop-Loss 0.7460. Take-Profit 0.7575, 0.7680


180618-_AU-_D.png


180618-_AU-_H4.png


*) For up-to-date and detailed analytics and news on the forex market visit Tifia Forex Broker website tifia.com
 
DJIA: indexes fall amid the escalation of the trade conflict

19/06/2018

Current dynamics


After last week, Washington imposed import duties on Chinese goods worth $ 50 billion, Beijing immediately threatened with retaliation for particularly significant US exports, such as oil, agricultural products and cars.

In both cases, import duties in the United States and China come into force on July 6. Markets responded quite cautiously to this step from Washington. On Monday President of the United States Donald Trump appealed to the administration with the task to make a list of Chinese goods worth $ 200 billion, for which duties will be imposed, thus increasing pressure on China.

Trump blames China for violating intellectual property rights and stealing technology. The White House clarified that the new fees will be levied if China does not change its position or will itself announce new tariffs for American goods. By such actions, Trump tries to create the most favorable conditions for the American economy, limiting the import of goods from China.

China reacted almost instantly. "If the US side completely loses its mind and publishes a new list, the Chinese side will be forced to take comprehensive quantitative and qualitative measures and give a decisive response", the Chinese trade department said in a statement.

Thus, the trade conflict between the US and China comes to a new level. This time the world stock markets have painfully reacted to the possible escalation of the conflict.

This next round in the aggravation of the situation may be a harbinger of a trade war between the two largest economies of the world.

News about the new trade disagreements between the US and China at the beginning of the trading day on Tuesday exerted strong pressure on European and world stock indices.

Shanghai Composite fell by 3.8% to a minimum in almost two years. Stoxx Europe 600 at the auction in the morning sank by 1.1%. Futures on the S & P 500 and Dow Jones Industrial Average indicate a loss of 1.3% and 1.6% respectively at the opening of trading.

*)An advanced fundamental analysis is available on the Tifia Forex Broker website at tifia.com/analytics


Support levels: 24425.0, 24050.0, 23750.0

Resistance levels: 24840.0, 25240.0, 25400.0, 25750.0, 26300.0, 26620.0


Trading Scenarios


Buy Stop 24860.0. Stop-Loss 24550.0. Take-Profit 25240.0, 25400.0, 25750.0, 26300.0, 26620.0

Sell Stop 24550.0. Stop-Loss 24860.0. Take-Profit 24425.0, 24050.0, 23750.0

190618-_DJIA-_D.png


190618-_DJIA-_H4.png


*) For up-to-date and detailed analytics and news on the forex market visit Tifia Forex Broker website tifia.com
 
WTI: There is expected to reduce inventories in the US oil storage reservoirs

20/06/2018


Current dynamics


According to the American Petroleum Institute (API) on Tuesday evening, US oil inventories fell by 3.016 million barrels last week. Gasoline stocks increased by 2.1 million barrels, and distillate stocks increased by 757,000 barrels. Nevertheless, this did not prevent the growth of oil prices on Wednesday. Brent crude oil futures rose 0.48% to $ 75.44 per barrel. The spot price for WTI oil at the beginning of the European session was close to $ 65.50 per barrel, which is about $ 0.6 higher than the opening price of the trading day.

The US Energy Information Administration's report on oil and petroleum products in the country's storage facilities will be released on Wednesday at 14:30 GMT, and investors will closely follow this publication.

As expected, commercial oil and oil products in the country's warehouses fell by 1.898 million barrels in the week of June 9-15.

This is positive information that can support oil price quotes.

Nevertheless, the main focus of the oil market participants will be focused on the OPEC meeting, which, as expected, can make important statements regarding the mitigation of the oil production reduction program. The OPEC meeting will begin on Thursday and will last until the end of the trading week.

Last month, Saudi Arabia and Russia announced plans to soften the terms of the OPEC+ agreement and increase oil production. The OPEC+ agreement on production reduction came into force in January 2017, and since then oil prices have risen by about 35%. The agreement expires at the end of 2018.

OPEC member Saudi Arabia and the non-cartel Russia insisted on increasing production. Iran's oil minister does not expect that this week the OPEC countries will agree on an increase in production. On Tuesday, he said that Tehran is against any increase.

If the member countries of the agreement do not agree on an increase in oil production, then oil prices will start to rise again. With the reverse scenario and an increase in production (expected to be 1 million barrels per day) prices could fall by about $ 15 per barrel.

Last Friday, a weekly report was released from the American oil service company Baker Hughes, according to which the number of active oil drilling rigs in the US increased again by 1 unit and currently stands at 863 units (against 862, 861, 859 and 844 in the past weeks). The growth of this indicator is another negative factor for the oil market and for oil prices.

Simultaneous growth in oil production in OPEC and the US can break the bullish trend of oil. This is especially true in the unfolding trade war between the US and China.

*)An advanced fundamental analysis is available on the Tifia Forex Broker website at tifia.com/analytics


Support levels: 63.70, 62.00, 61.00

Resistance levels: 65.50, 67.00, 68.00, 68.85, 70.00, 71.25, 72.80, 74.00, 75.00


Trading Scenarios


Sell Stop 64.80. Stop-Loss 65.90. Take-Profit 64.00, 63.00, 62.00, 61.00

Buy Stop 65.90. Stop-Loss 64.80. Take-Profit 67.00, 68.00, 68.85, 70.00, 71.25, 72.80, 74.00, 75.00


200618-_WTI-_D.png


200618-_WTI-_H4.png


*) For up-to-date and detailed analytics and news on the forex market visit Tifia Forex Broker website tifia.com
 
DJIA: negative dynamics prevails

25/06/2018

Current dynamics


The main US stock indices rose on Friday, mainly due to oil and gas sector securities against the backdrop of a restrained OPEC decision to increase oil production. S&P500 rose by 0.2% on Friday to 2,754.88 points, although it lost 24.78 points, or 0.9%, over the week.

DJIA on Friday increased by 119.19 points (+0.5%), to 24580.89 points. However, for the week also fell, losing 509.59 points, or 2%.

Since mid-June, the main US stock indexes are declining. The escalation of international trade conflicts, or rather, the escalation of the contradictions in the US trade relations with other major partners such as China, the EU, Canada, contribute to the fact that investors escape from the risks of buying high-yield assets of the stock markets. In this situation, the dollar is a protective asset. Additional pressure on the stock indices is the actions of the Fed. As you know, in mid-June, the Fed raised the rate by 0.25% and signaled a higher rate of tightening of monetary policy.

US President Donald Trump on Friday threatened to introduce a 20% duty on cars from the EU after the European Commission began to impose duties on various American products. The EU took a response to the introduction of import duties in the United States on the import of European steel and aluminum in the amount of 25% and 10%, respectively.

Earlier, Donald Trump instructed his administration to additionally draw up a list of Chinese goods worth $ 200 billion, for which duties will be introduced. Trump accuses China of violating intellectual property rights and technology theft, as well as in disproportionate import duties and restrictions on the importation of American goods into the country.

China immediately reacted to Washington's actions, saying that "if the US side completely lost the mind and published a new list, the Chinese side will be forced to take comprehensive quantitative and qualitative measures and give a decisive respond".

In both cases, import duties in the United States and China come into force on July 6.

On Sunday, US President Donald Trump called on all countries that have established artificial trade barriers and duties to eliminate them. "The United States insists that all countries that have established artificial trade barriers and duties on goods coming to them, eliminate these duties and barriers, otherwise they will face more than reciprocity from the United States", he wrote in his Twitter.

Investors are worried about the increasing deterioration of trade relations in the world. According to the Bank of America Merrill Lynch, over the last week, investors have withdrawn the largest since 2016, the volume of funds from equity funds, financial instruments and bonds of investment grade emerging markets.

Shares of industrial, agricultural and automotive companies fell last week. DJIA on Thursday finished with losses eighth consecutive session. This is the longest such series in more than a year.

*)An advanced fundamental analysis is available on the Tifia Forex Broker website at tifia.com/analytics


Support levels: 24425.0, 24050.0, 23800.0, 23120.0, 22450.0

Resistance levels: 24800.0, 25400.0, 25750.0, 26200.0, 26620.0


Trading Scenarios


Buy Stop 24700.0. Stop-Loss 24300.0. Take-Profit 24800.0, 25400.0, 25750.0, 26200.0, 26620.0

Sell Stop 24300.0. Stop-Loss 24700.0. Take-Profit 24050.0, 23800.0, 23120.0, 22450.0


250618-_DJIA-_D.png


250618-_DJIA-_H4.png


*) For up-to-date and detailed analytics and news on the forex market visit Tifia Forex Broker website tifia.com
 
DJIA: investors' pessimism prevails

02/07/2018

Current dynamics


Major US stock indexes began a new month and a quarter with a fall. On Monday, US and world stock indices are falling amid escalation of international trade conflicts, weak economic data on China, deterioration of the political situation in the German government.

The strongest decline is - of banks shares, automobile companies and firms connected with the raw materials sphere.

Trump is considering the possibility of imposing duties on imports of cars in the US at a rate of 20%, including from Europe.

The presidential administration is currently studying this issue.

Discussing the course of the negotiations on the revision of the terms of the North American Free Trade Agreement with Mexico and Canada (NAFTA), Trump said that "if they do not like it, I will tax the cars they bring to the US, and that's serious".

Since mid-June, the main US stock indexes are declining. And today is not an exception. Pessimism of investors and negative dynamics of stock indices prevail.

*)An advanced fundamental analysis is available on the Tifia Forex Broker website at tifia.com/analytics


Support and resistance levels

With the opening of the trading day on Monday, the DJIA is down, coming close to a strong support level of 24050.0 (EMA200 on the daily chart and Fibonacci level of 23.6% of the correction to the growth from the level of 15650.0 in the wave that began in January 2016. The maximum of this wave and the Fibonacci level 0 % are near the mark of 26620.0).

The breakdown of the support levels 24050.0, 23800.0 (EMA50 on the weekly chart) will significantly increase the risks of breaking the bullish trend.

Indicators OsMA and Stochastics on the daily, weekly, monthly charts recommend short positions.

The first signal for the resumption of the upward dynamics will be the breakdown of the short-term resistance level 24425.0 (EMA200 on the 1-hour chart).

The breakdown of resistance level 24650.0 (EMA200 on the 4-hour chart) will confirm the resumption of the upward dynamics and bullish trend of DJIA.

The nearest growth target is resistance level 25400.0 (June highs). In the event of a breakdown of the resistance level 25400.0, the DJIA will head towards resistance levels 25750.0, 26620.0 (absolute and annual highs).

Support levels: 24050.0, 23800.0, 23120.0, 22450.0

Resistance levels: 24425.0, 24650.0, 25400.0, 25750.0, 26200.0, 26620.0


Trading Scenarios


Buy Stop 24350.0. Stop-Loss 23950.0. Take-Profit 24425.0, 24650.0, 25400.0, 25750.0, 26200.0, 26620.0

Sell Stop 23950.0. Stop-Loss 24350.0. Take-Profit 23800.0, 23120.0, 22450.0


020718-_DJIA-_D.png


020718-_DJIA-_H4.png


*) For up-to-date and detailed analytics and news on the forex market visit Tifia Forex Broker website tifia.com
 
GBP/USD: Market expectations

05/07/2018


The central event on Thursday will be the publication (at 18:00 GMT) of the minutes from the June Fed meeting. The publication of the protocol is extremely important for determining the course of the current policy of the Fed and the prospects for raising the interest rate in the US, because recently, from the leaders of the Federal Reserve more often you can hear statements that testify to the Fed's inclination to accelerate the rate of interest rate increase.

Volatility during the publication of the protocol is usually increased, since the text of the protocol often contains either changes or clarifying the details of the outcome of the previous FOMC meeting.

Also, market participants will follow the speech of the head of the Bank of England Mark Carney, which will start at 10:00 (GMT). Volatility in the pound trade in this period of time may rise sharply, because Mark Carney is able to unfold the markets with his unexpected statements. If he does not touch upon the questions of the monetary policy of the Bank of England, the reaction to his speech will be weak.

It is also necessary to pay attention to the publication of a block of important macro data from the United States in the period from 12:15 to 14:00 (GMT). Among other data - the publication of the ADP report on employment in the private sector in the US in June. This report usually has a strong impact on the market and the dollar quotes. Although there is usually no direct correlation with Non-Farm Payrolls, the ADP report is considered the harbinger of the official report of the US Department of Labor on the overall state of the labor market in the country. Strong data positively affects the dollar. The number of employees in the US private sector is expected to increase by 190,000 (against +178,000 in May). Reducing the result could negatively affect the dollar.

Thus, on Thursday an extremely volatile trading day is expected, especially in the American trading session.

*)An advanced fundamental analysis is available on the Tifia Forex Broker website at tifia.com/analytics


Support levels: 1.3210, 1.3195, 1.3105, 1.3035, 1.3000, 1.2900

Resistance levels: 1.3260, 1.3320, 1.3410, 1.3500


Trading Scenarios


Sell Stop 1.3210. Stop-Loss 1.3260. Take-Profit 1.3195, 1.3105, 1.3035, 1.3000, 1.2900

Buy Stop 1.3260. Stop-Loss 1.3210. Take-Profit 1.3320, 1.3410, 1.3500


050718-_DXY.jpg


050718-_GU-_D.jpg


050718-_GU-_H4.jpg


050718-_GU-_H1.jpg


*) For up-to-date and detailed analytics and news on the forex market visit Tifia Forex Broker website tifia.com
 
DJIA: investors' optimism rose

09/07/2018

Current dynamics


Investors enthusiastically met with a strong report on the US labor market, published last Friday, as well as information about the next reduction in the deficit of the US foreign trade balance.

According to the data presented, the deficit of trade in goods and services in the US in May fell by 6.6% compared to the previous month, amounting to $ 43.05 billion. Thus, the deficit of foreign trade in May was the lowest since October 2016.

At the same time, although unemployment rose to 4.0% from 3.8% in May, the number of jobs outside the country's agriculture increased by 213 000 in June (the forecast was +200 000). Also upward, NFP data for the previous two months were revised.

The number of jobs outside of US agriculture increases for 93 consecutive months, which is the longest such period in the history of such statistics, and speaks of a strong labor market.

Steady hiring of workers and low unemployment indicate that the US labor market remains a strong place in the country's economy since the end of the recession nine years ago. At present, activity in other sectors seems to be accelerating as well. Some economists predict that the country's GDP growth in the second quarter exceeded 4% per annum for the first time since 2014.

The main US stock indexes today continued to rise against the background of strong macroeconomic indicators for the US, published last week. The escalation of the US trade contradictions with other countries, for the time being, seems to be taking a back seat.

*)An advanced fundamental analysis is available on the Tifia Forex Broker website at tifia.com/analytics


Support and resistance levels

With the opening of the trading day on Monday, DJIA is growing. And the growth is already the fourth trading day. Strong support levels of 24100.0 (EMA200 on the daily chart), 24050.0 (Fibonacci level of 23.6% of the correction to the growth from the level of 15650.0 in the wave, which began in January 2016. The maximum of this wave and the Fibonacci 0% level are near the mark of 26620.0) have stopped falling DJIA in the end of the last month.

At the beginning of the European session, DJIA is trading at a strong resistance level of 24580.0 (EMA50 on the daily chart and EMA200 on the 4-hour chart).

Breakdown of this resistance level will confirm the resumption of the upward dynamics and bullish trend of DJIA.

Indicators OsMA and Stochastics on the 4-hour, daily charts went to the side of buyers.

The nearest growth target is resistance level 25400.0 (June highs). In the event of a breakdown of the resistance level 25400.0, the DJIA will head towards resistance levels 25750.0, 26620.0 (absolute and annual highs).

In the alternative scenario, the breakdown of the support levels 24050.0, 23800.0 (EMA50 on the weekly chart) will significantly increase the risks of breaking the bullish trend.

Support levels: 24380.0, 24100.0, 24050.0, 23800.0, 23120.0, 22450.0

Resistance levels: 24580.0, 25000.0, 25400.0, 25750.0, 26200.0, 26620.0


Trading Scenarios


Buy Stop 24610.0. Stop-Loss 24460.0. Take-Profit 25000.0, 25400.0, 25750.0, 26200.0, 26620.0

Sell Stop 24460.0. Stop-Loss 24610.0. Take-Profit 24380.0, 24100.0, 24050.0, 23800.0, 23120.0, 22450.0


090718-_DJIA-_D.png


090718-_DJIA-_H4.png


*) For up-to-date and detailed analytics and news on the forex market visit Tifia Forex Broker website tifia.com
 
DJIA: indices retain positive dynamics

13/07/2018

Current situation


American stock indexes retain a positive dynamics, developing an upward correction.

Earlier in the week, the stock market saw a large-scale sale in the light of renewed fears about trade relations between the US and China.

As you know, the White House announced its intention to introduce additional 10-percent duties on Chinese goods worth $ 200 billion.

Previously, Trump threatened to impose duties on all exports from China, which is $ 505 billion a year.

Nevertheless, the threat of an escalation of trade contradictions between the US and China has so far come to the fore.

US Treasury Secretary Stephen Mnuchin on Thursday rejected the possibility of consequences of the introduction of duties announced by the administration of US President Donald Trump. Mnuchin said that the US economy will not suffer as a result of these duties.

Investors focus on the reports of the largest US companies and on positive macro statistics coming from the US, indicating the acceleration of the growth of the American economy.

The producer price index rose in June, which was another sign of increased inflationary pressures in the US. The index of final demand (PPI), which displays the cost of goods and services, appointed by companies, in June rose by 0.3%.

Compared to the same period of the previous year, PPI in June grew by 3.4%, which was the strongest annual growth since November 2011.

The consumer price index in June increased by 2.9% compared to the same period of the previous year, showing the strongest growth since 2012.

Even if the indices are down today, they will end the week in positive territory anyway.

*)An advanced fundamental analysis is available on the Tifia Forex Broker website at tifia.com/analytics


Support and resistance levels

While DJIA is trading above the key support levels of 24130.0 (EMA200 on the daily chart), 24050.0 (the Fibonacci level of 23.6% of the correction to the growth from the level of 15650.0 in the wave, which began in January 2016. The maximum of this wave and the Fibonacci 0% level are near the mark of 26620.0), positive dynamics remain, and the bullish trend is not threatened.

Breakdown of the local resistance level of 24940.0 (July highs) will accelerate the recovery and growth of the DJIA. In the event of a breakdown of the resistance level 25400.0 (June highs), the DJIA will head towards the resistance levels 25750.0, 26620.0 (absolute and annual highs).

The signal for sales will be a breakdown of the short-term support level of 24630.0 (EMA200 on the 4-hour chart).

Support levels: 24630.0, 24400.0, 24130.0, 24050.0, 23800.0, 23120.0, 22450.0

Resistance levels: 24940.0, 25000.0, 25400.0, 25750.0, 26200.0, 26620.0


Trading Scenarios


Buy Stop 25020.0. Stop-Loss 24880.0. Take-Profit 25400.0, 25750.0, 26200.0, 26620.0

Sell Stop 24880.0. Stop-Loss 25020.0. Take-Profit 24600.0, 24400.0, 24130.0, 24050.0, 23800.0, 23120.0, 22450.0

130718-_DJIA-_D.png


130718-_DJIA-_H4.png


*) For up-to-date and detailed analytics and news on the forex market visit Tifia Forex Broker website tifia.com
 
XAU/USD: Demand for the dollar persists

16/07/2018

Current dynamics


Despite the continuing, and even accelerating, growth of the US economy, some economists still believe that in the US, in about two years, a recession may begin.

This means that the growth of the economy may slow from the middle of next year, and towards its end become zero. The probability of such a scenario is 85%.

The basis of such assumptions is the declining difference in yields of 2-year and 10-year US bonds. If this trend continues, then, as historical observations show, in another 12 months a recession may begin. This is a long-term negative scenario for the dynamics of the dollar.

Meanwhile, the dollar continues to be in demand and strengthened amid expectations of further tightening of the Fed's monetary policy, as well as positive macro statistics coming from the US.

Today at 12:30 (GMT) data on retail sales in the US will be published. A relative decline in sales is expected (+ 0.5% in June against + 0.8% in May). If the data is even weaker, the dollar may fall.

Nevertheless, investors will wait for new signals from the head of the Fed, Jerome Powell, regarding monetary policy.

Hard Powell rhetoric coupled with positive forecasts will again force investors to buy the dollar. Possibly, Powell will also touch upon the topic of US trade relations with China. As you know, last week the US Treasury Secretary Stephen Mnuchin ruled out the possibility of negative impact on the US economy from the introduction of duties. Mnuchin said that the US economy will not suffer as a result of this.

Powell will speak twice this week, on Tuesday (14:00 GMT) and on Wednesday (also at 14:00).

If Powell confirms the Fed's desire to further raise rates in the US, then gold will continue to decline in price.

In conditions of an increase in the interest rate, the investment attractiveness of the dollar is growing, and of gold is falling. The likelihood that the Fed will raise rates this year four times rose to 60%. This is one of the highest levels this year.

*)An advanced fundamental analysis is available on the Tifia Forex Broker website at tifia.com/analytics


Support and resistance levels

With the opening of the trading day on Monday, the XAU / USD is growing against the background of a weakening dollar.

Nevertheless, below the resistance levels of 1250.00 (EMA200 on the 1-hour chart), 1248.00 (the Fibonacci level of 50% of the correction to the wave of decline since July 2016), the downward trend predominates.

The signal for purchases will be a breakdown of the short-term resistance level of 1250.00. In this case, corrective growth can last up to resistance level 1268.00 (EMA200 on the 4-hour chart).

The breakdown of the support level of 1237.00 (annual lows) will confirm the return of XAU / USD to the global downtrend, which began in October 2012.

Support levels: 1237.00, 1220.00

Resistance levels: 1248.00, 1250.00, 1268.00, 1277.00, 1283.00, 1295.00


Trading Scenarios


Sell in the market. Stop-Loss 1252.00. Take-Profit 1273.00, 1220.00, 1200.00

Buy Stop 1252.00. Stop-Loss 1239.00. Take-Profit 1268.00, 1277.00, 1283.00, 1295.00

160719-_XU-_D.png


160719-_XU-_H4.png


160719-_XU-_H4.png


*) For up-to-date and detailed analytics and news on the forex market visit Tifia Forex Broker website tifia.com
 
Back
Top