Tifia Forex Broker Daily Market Analytics, Analytics and trading recommendations by Tifia Company

AUD/USD: Support and resistance levels

20/08/2018


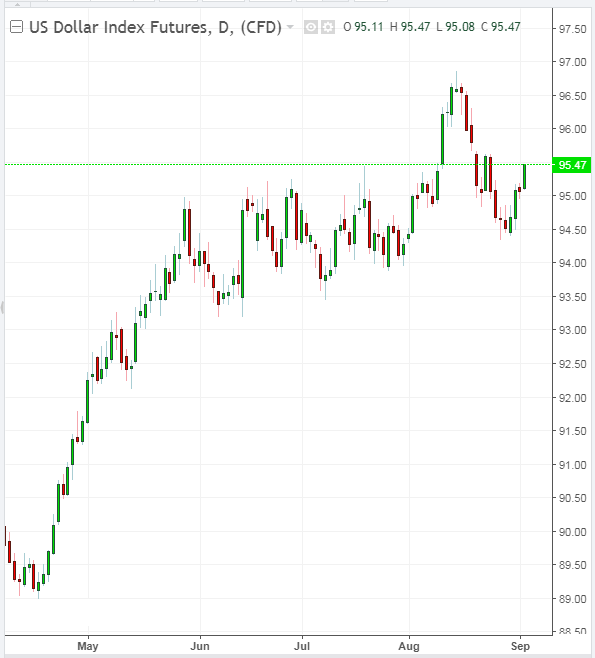
The different focus of monetary policy of central banks in the US and Australia will be the main most important long-term factor in favor of weakening the AUD / USD pair.

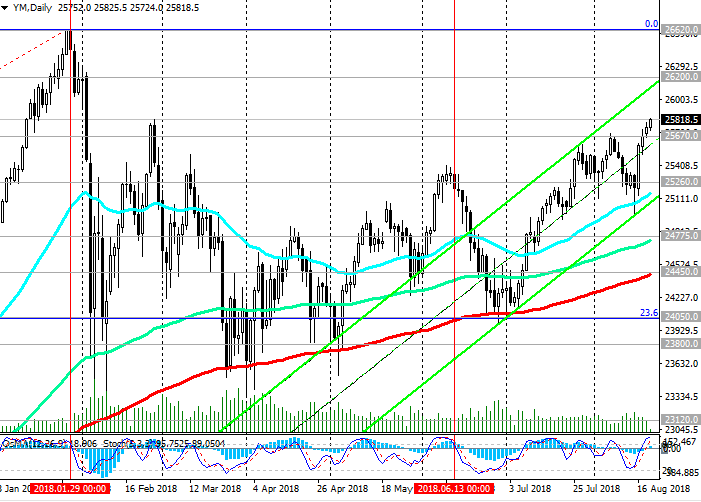
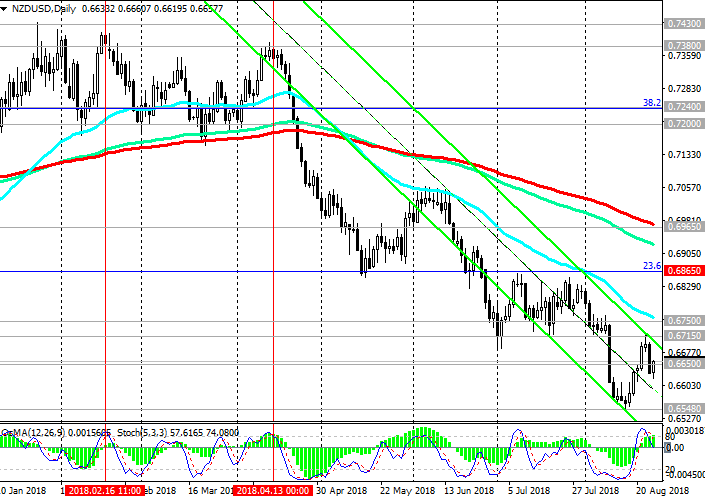
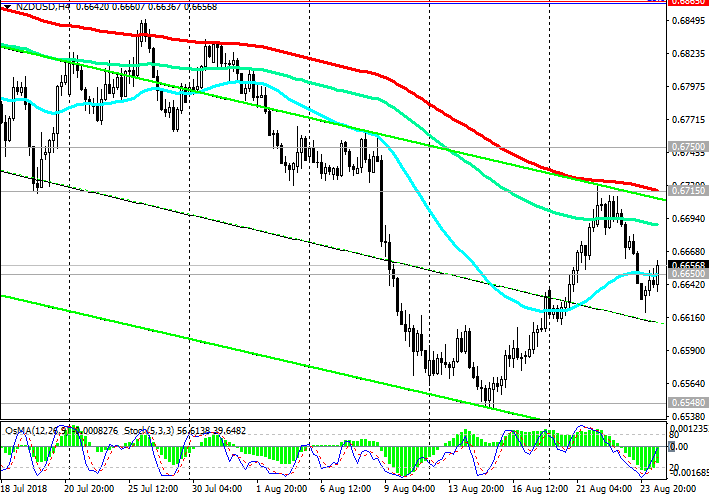
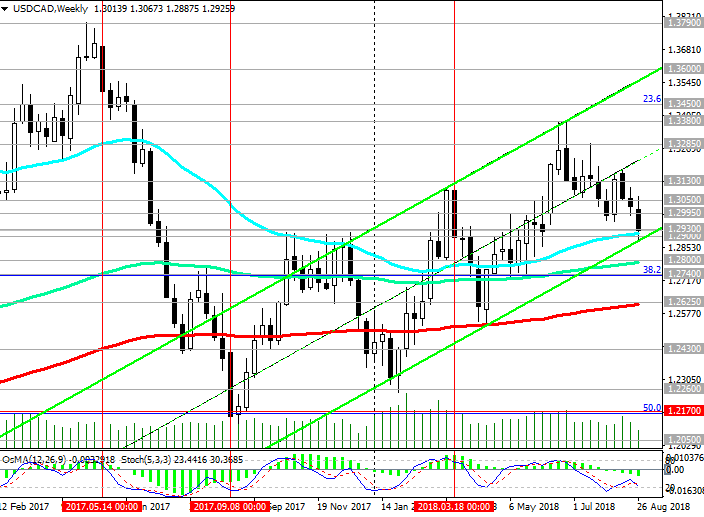
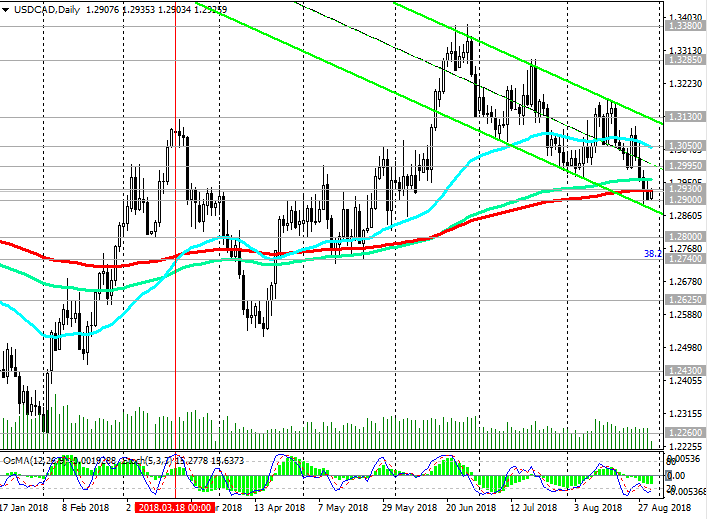
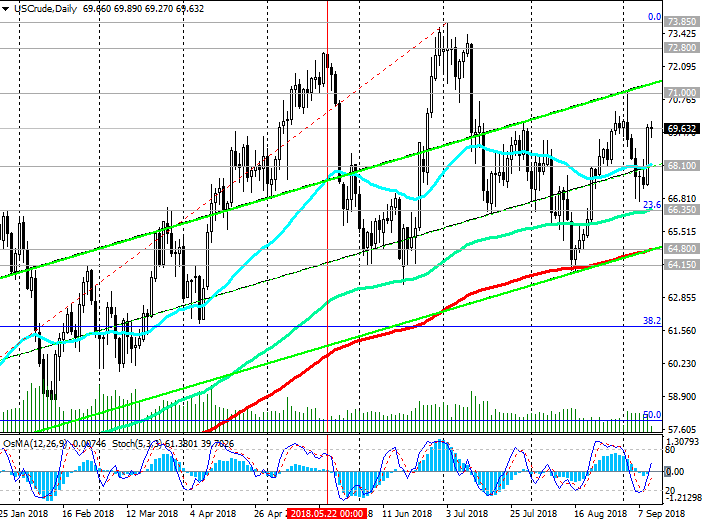
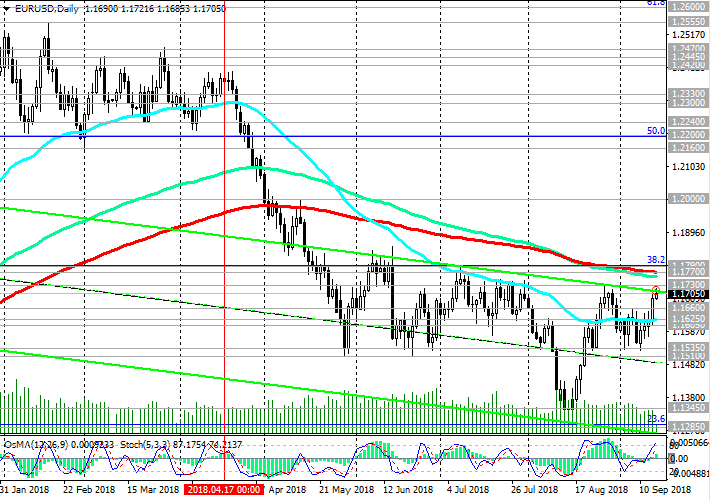
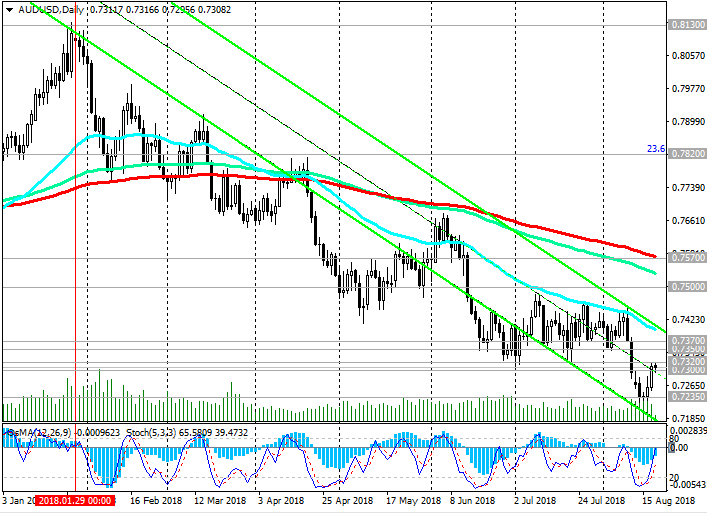
Since the beginning of the year, the AUD / USD has been actively declining. AUD / USD develops a downward trend, trading in the downward channel on the daily chart, the lower limit of which near the support level of 0.7155 passes.

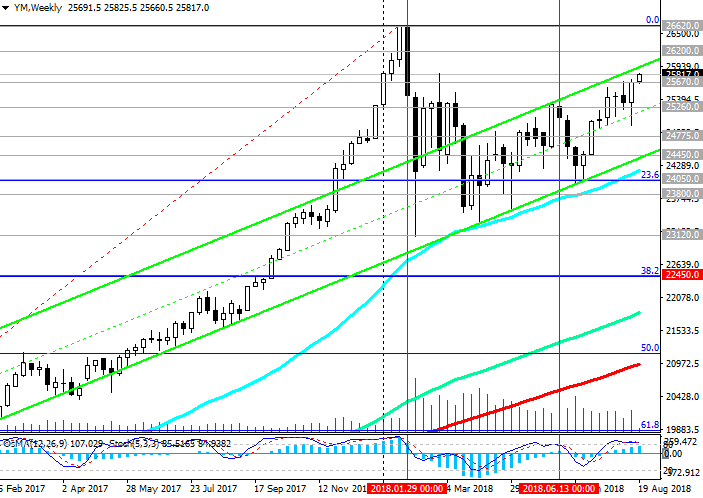
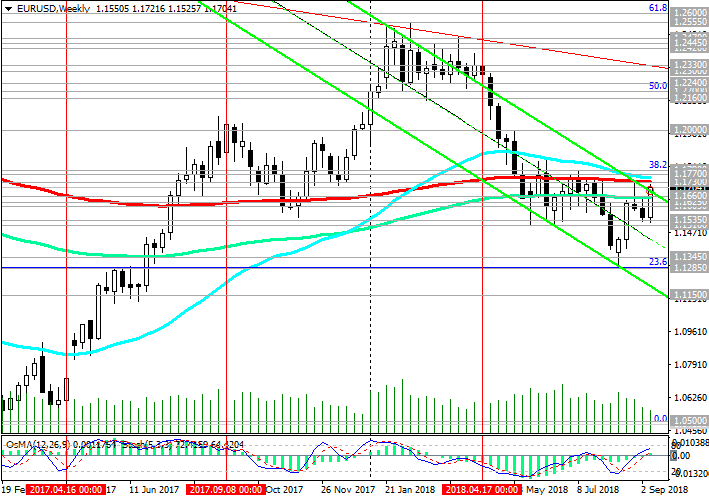
Indicators OsMA and Stochastics on long-term periods (weekly and monthly) indicate short positions.

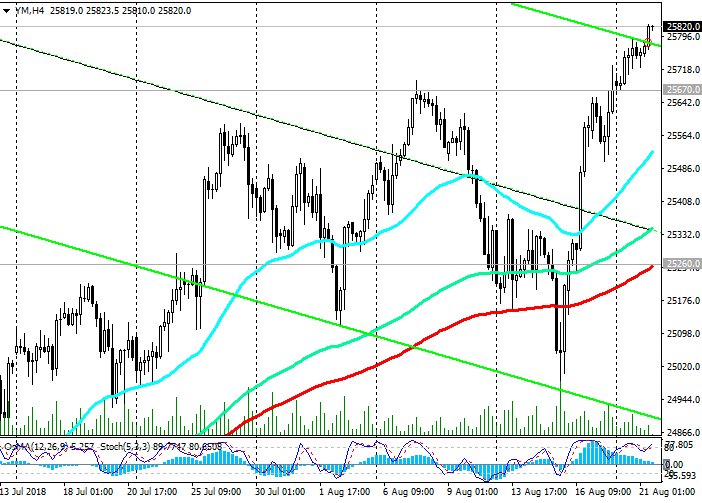
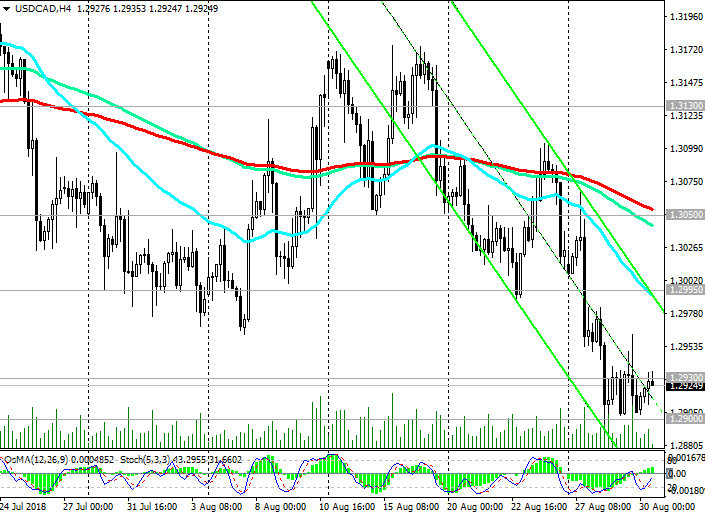
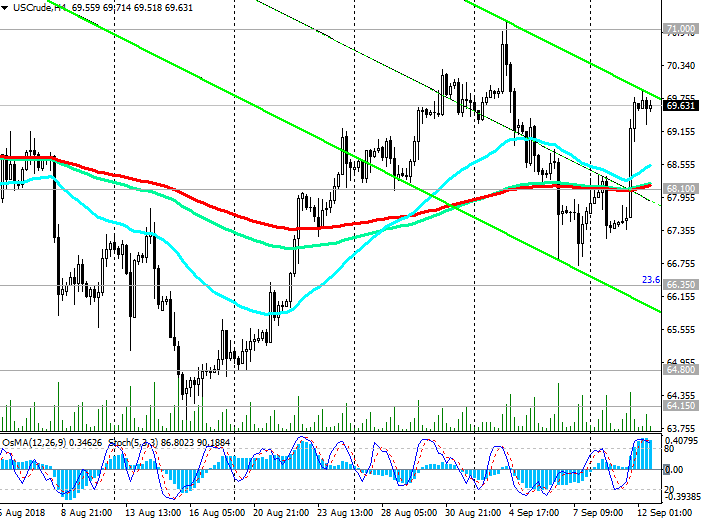
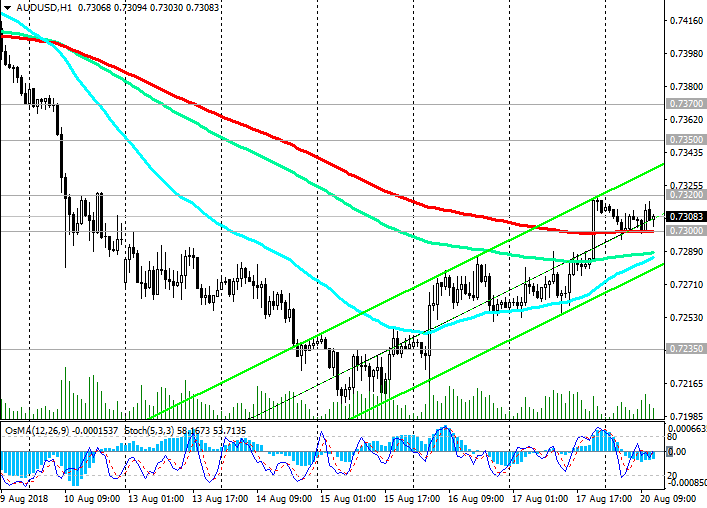
In case of further decrease in AUD / USD, the targets will be support levels of 0.7235 (August lows), 0.7155 (the bottom line of the descending channel on the daily chart). Only in case of the return of AUD / USD to the zone above the key resistance level of 0.7570 (EMA200 on the daily chart) long-term long positions can be considered with targets at the levels of 0.7820 (EMA200 on the weekly chart and Fibonacci level of 23.6% of the correction to the fall wave from August 2011 year and level 1.1030. The minimum of this wave is near the level of 0.6830). The signal for purchases may be a breakdown of the short-term resistance level 0.7370 (EMA200 on the 4-hour chart). So far, negative dynamics prevails. Short positions are preferred. The immediate goal of the decline is the support level of 0.7235 (the lows of the year and August). The AUD / USD is returning to the global downtrend, which began in August 2011.

*)An advanced fundamental analysis is available on the Tifia Forex Broker website at tifia.com/analytics


Support levels: 0.7300, 0.7235, 0.7200, 0.7155, 0.7100

Resistance levels: 0.7320, 0.7350, 0.7370, 0.7500, 0.7570


Trading Scenarios


Sell Stop 0.7290. Stop-Loss 0.7330. Take-Profit 0.7235, 0.7200, 0.7155, 0.7100

Buy Stop 0.7330. Stop-Loss 0.7290. Take-Profit 0.7350, 0.7370, 0.7500, 0.7570

200818-_AU---_D.png


200818-_AU---_H1.png


*) For up-to-date and detailed analytics and news on the forex market visit Tifia Forex Broker website tifia.com
 
DJIA: stock markets are growing

21/08/2018

Current situation


US and world stock indexes continue to grow. Investors were encouraged by reports of the resumption of negotiations between the US and China with a view to resolving the trade conflict between the countries. Market participants also expect that strong US economic data and financial results of companies will continue to support the indices.

DJIA rose on Monday by 0.3%, to 25758.69 points, the highest level of closure since February 1. S&P500 added 0.2%, reaching 2857.05 points, which is 0.6% lower than the January record. Nasdaq Composite increased by 0.1%, to 7821.01 points. All three major US indices are growing on Tuesday for 4 consecutive days.

The main risk for the economy and the stock market at the moment are trade conflicts. As they weaken, the growth of US stock indices is likely to accelerate.

*)An advanced fundamental analysis is available on the Tifia Forex Broker website at tifia.com/analytics


Support and resistance levels

DJIA retains positive dynamics, trading in the ascending channels on the daily and weekly charts. Above the short-term support level of 25260.0 (EMA200 on the 4-hour chart and the bottom line of the rising channel on the daily chart), only long positions should be considered.

The breakdown of the support level of 25260.0 may provoke a deeper correction decrease to the key support levels 24775.0 (EMA144 on the daily chart), 24450.0 (EMA200 on the daily chart). Near these levels also passes the bottom line of the rising channel on the weekly chart.

In general, the positive dynamics remains. Only the breakdown of the support level of 24050.0 (the Fibonacci retracement level of 23.6% of the correction to the growth from the level of 15650.0 in the wave that began in January 2016. The maximum of this wave and the 0% Fibonacci level are near the 26620.0 mark) may call into question the DJIA's bullish trend.

DJIA is growing, heading toward resistance level 26620.0 (absolute and annual highs).

Support levels: 25670.0, 25260.0, 25000.0, 24775.0, 24450.0, 24050.0

Resistance levels: 26000.0, 26200.0, 26620.0


Trading Scenarios


Buy in the market. Stop-Loss 25650.0. Take-Profit 26200.0, 26620.0

Sell Stop 25650.0. Stop-Loss 25800.0. Take-Profit 25260.0, 25000.0, 24775.0, 24450.0

210818-_DJIA-_D.png


210818-_DJIA-h4.png


210818-_DJIA-_W.png


*) For up-to-date and detailed analytics and news on the forex market visit Tifia Forex Broker website tifia.com
 
NZD/USD: Support and resistance levels

24/08/2018


Since mid-April, the NZD / USD has been trading in a downward channel, falling from the level of 0.7380. In August, NZD / USD reached multi-month lows near the 0.6548 mark. The negative trend persists, and NZD / USD is traded in the descending channel on the daily chart.

In the event of a breakdown of the support level of 0.6548, NZD / USD will target at lows 2015 near the 0.6260 mark.

The objective of the upward correction after the breakdown of the resistance level 0.6715 (EMA200 on the 4-hour chart) may be the resistance level of 0.6865 (Fibonacci level of 23.6% of the upward correction to the global wave of the pair's decline from the level of 0.8800, which began in July 2014, level of 0.6260 and the upper limit of the range formed in July).

The prevailing negative dynamics. Short positions are preferred. The global downtrend, which began in July 2014, resumed.

Investors are preparing for the speech of Federal Reserve Chairman Jerome Powell at a symposium in Jackson Hole on Friday (14:00 GMT). Investors are interested in Powell's opinion about the growing US-China trade confrontation and the prospects for the monetary policy of the Fed.

*)An advanced fundamental analysis is available on the Tifia Forex Broker website at tifia.com/analytics


Support levels: 0.6600, 0.6548, 0.6500, 0.6410

Resistance levels: 0.6650, 0.6715, 0.6750, 0.6865, 0.6900, 0.6965


Trading Scenarios


Sell Stop 0.6620. Stop-Loss 0.6665. Take-Profit 0.6600, 0.6548, 0.6500, 0.6410

Buy Stop 0.6665. Stop-Loss 0.6620. Take-Profit 0.6715, 0.6750, 0.6865, 0.6900, 0.6965


240818-_NU-_D.png


240818-_NU-h4.png


*) For up-to-date and detailed analytics and news on the forex market visit Tifia Forex Broker website tifia.com
 
DJIA: stock markets are growing

28/08/2018

Current situation


US and world stock indexes continue to grow. Investors were encouraged by reports that the US and Mexico were approaching the conclusion of a treaty on the revision of the North American Free Trade Agreement (NAFTA), ignoring the possibility of excluding Canada from the trade union.

On the eve of Nasdaq, in which the technological sector has a lot of weight, for the first time overcame the mark of 8,000 points. The S&P 500 also reached new absolute record levels.

DJIA rose from the beginning of the week by 1.16% to 26105.0, the mark at which it traded at the beginning of the European session on Tuesday.

All three major US indices are growing on Tuesday for 3 consecutive days after Friday, Fed Chairman Jerome Powell said that the gradual increase in interest rates remains appropriate. However, Powell did not signal that the central bank will accelerate rates of rate hikes in the coming months. He said that the Fed plans to raise rates to a level that will neither stimulate nor slow economic growth.

The main risk for the economy and the stock market at the moment are trade conflicts. As they weaken, the growth of US stock indices is likely to accelerate.

*)An advanced fundamental analysis is available on the Tifia Forex Broker website at tifia.com/analytics


Support and resistance levels

DJIA retains positive dynamics, trading in the ascending channels on the daily and weekly charts. Above the short-term support level 25420.0 (EMA200 on the 4-hour chart and the bottom line of the upward channel on the daily chart), only long positions should be considered.

The breakdown of the support level of 25420.0 may provoke a deeper correction decrease to the key support levels of 24830.0 (EMA144 on the daily chart), 24530.0 (EMA200 on the daily chart). Near these levels also passes the bottom line of the rising channel on the weekly chart.

In general, the positive dynamics remains. Only the breakdown of the support level of 24050.0 (Fibonacci level of 23.6% of the correction to the increase with the level of 15650.0 in a wave that began in January 2016. The maximum of the wave and Fibonacci level of 0% are near the mark 26620.0) could jeopardize the bullish trend of the DJIA.

DJIA is growing, heading toward resistance level 26620.0 (absolute and annual highs).

Support levels: 26000.0, 25750.0, 25420.0, 25000.0, 24830.0, 24530.0, 24050.0

Resistance levels: 26200.0, 26620.0


Trading Scenarios


Buy in the market. Stop-Loss 26000.0. Take-Profit 26200.0, 26620.0

Sell Stop 26000.0. Stop-Loss 26140.0. Take-Profit 25750.0, 25420.0, 25000.0, 24830.0, 24530.0, 24050.0

280818-_DJIA-_W.png


280818-_DJIA-_D.png


280818-_DJIA-_H4.png


*) For up-to-date and detailed analytics and news on the forex market visit Tifia Forex Broker website tifia.com
 
USD/CAD: Support and resistance levels

30/08/2018


The USD / CAD keeps the medium-term negative dynamics, trading in the downward channel on the daily chart. At the same time, USD / CAD remains in the upward channel on the weekly chart, the upper limit of which passes near the resistance level 1.3600 (the highs of November, December 2016).

While USD / CAD is trading above the important support level of 1.2930 (200-period moving average on the daily chart), long-term positive dynamics remain.

In the vicinity of this support level 1.2930, the bottom line of the upward channel and EMA50 on the weekly chart also pass.

Thus, the support level of 1.2930 is the key.

In case of its breakdown, USD / CAD will go to support levels 1.2800 (EMA144 on the weekly chart), 1.2740 (Fibonacci level 38.2% of the downward correction to the pair's growth in the global uptrend from September 2012 and the 0.9700 mark).

The breakdown of the support level 1.2625 (EMA200 on the weekly chart) raises the risks of the final breakdown of the bullish USD / CAD trend.

The growth scenario is related to the breakdown of the resistance level 1.3050 (EMA200 on the 4-hour chart) and the resumption of positive dynamics within the rising channel on the weekly chart. The first signal for purchases will be the breakdown of the nearest short-term resistance level of 1.2995 (EMA200 on the 1-hour chart).

*)An advanced fundamental analysis is available on the Tifia Forex Broker website at tifia.com/analytics


Support levels: 1.2930, 1.2900, 1.2800, 1.2740, 1.2625

Resistance levels: 1.2995, 1.3050, 1.3130, 1.3200, 1.3285, 1.3380, 1.3450


Trading Scenarios


Sell Stop 1.2890. Stop-Loss 1.2945. Take-Profit 1.2800, 1.2740, 1.2625

Buy Stop 1.2945. Stop-Loss 1.2890. Take-Profit 1.2995, 1.3050, 1.3130, 1.3200, 1.3285, 1.3380, 1.3450


300818-_UC---_W.png


300818-_UC---_D.png


300818-_UC---_H4.png


*) For up-to-date and detailed analytics and news on the forex market visit Tifia Forex Broker website tifia.com
 
USD/CAD: Support and resistance levels

04/09/2018


On Wednesday (14:00 GMT) the Bank of Canada decision on rates will be published. It is likely that in the face of the unresolved issue on NAFTA, the Bank of Canada is unlikely to decide to change its monetary policy. The interest rate is likely to remain at 1.50%.

On Tuesday, USD / CAD broke the upper limit of the downward channel on the daily chart, thus breaking the medium-term negative dynamics.

Indicators OsMA and Stochastics on the 4-hour, daily, weekly charts went to the side of buyers.

Above the short-term support level 1.3055 (EMA200 on the 4-hour chart, EMA50 on the daily chart) long positions are preferred.

In general, long-term upward dynamics persist, and USD / CAD is rising in the upward channel on the weekly chart, the upper limit of which is near the resistance level 1.3600 (highs of November, December 2016).

The support level of 1.2930 (200-period moving average on the daily chart) is the key, long-term positive dynamics remain above it.

Long positions are relevant.

The first signal for the development of an alternative scenario may be a decline to a zone below the 1.3112 mark, through which the upper limit of the descending channel on the daily chart passes. The breakdown of the support level 1.3055 will confirm this scenario.

However, only the breakdown of the support level 1.2625 (EMA200 on the weekly chart) will signal a final break of the bullish USD / CAD trend.

*)An advanced fundamental analysis is available on the Tifia Forex Broker website at tifia.com/analytics


Support levels: 1.3112, 1.3100, 1.3055, 1.2970, 1.2930, 1.2900

Resistance levels: 1.3175, 1.3200, 1.3285, 1.3380, 1.3450


Trading Scenarios


Sell Stop 1.3080. Stop-Loss 1.3160. Take-Profit 1.3055, 1.2970, 1.2930, 1.2900

Buy Stop 1.3160. Stop-Loss 1.3080. Take-Profit 1.3175, 1.3200, 1.3285, 1.3380, 1.3450


040918-dxy.png


040918-_UC--_D.png


040918-_UC--_H4.png


*) For up-to-date and detailed analytics and news on the forex market visit Tifia Forex Broker website tifia.com
 
GBP/USD: on the eve of the meeting of the Bank of England

11/09/2018

Current dynamics


The US dollar declined on Monday. The driver of its decline was the message that the UK and the EU have made progress on Brexit negotiations.

The EU's chief negotiator for Brexit, Michel Barnier, said that an agreement with the UK could be reached in the next six to eight weeks. In response to this message, the pound rose sharply, including against the dollar, carrying with it other currencies, primarily European ones.

On Tuesday, with the opening of the trading day, the decline in the dollar continued. However, closer to the beginning of the US trading session, the decline in the dollar slowed, and the dollar index DXY, which tracks the rate of the US currency against the basket of 6 other major currencies, shifted to positive territory near 95.20, 6 points higher than the opening level of the trading day.

This week, investors will follow the meeting of the Bank of England, which will be held on Thursday September 13, and at 11:00 (GMT) will publish the decision on the interest rate. It is expected that the rate will remain at the same level of 0.75%. Economists believe that the next rate increase will occur no earlier than May next year.

The main risks for the UK after Brexit are associated with expectations of a slowdown in the country's economic growth, as well as a large current account deficit in the UK's balance of payments.

Meanwhile, the Fed is likely to continue tightening monetary policy. As Federal Reserve President Boston Rosengren said in an interview with the WSJ on Monday, "The US economy has good performance, and there is no need to slow or accelerate the current rate of quarterly rate increases". Rosengren sees no reason to pause the rate hike until economic growth and inflation slows. And this means, in his opinion, the Fed will raise the rate this year 2 more times. This is a bullish factor for the dollar.

*)An advanced fundamental analysis is available on the Tifia Forex Broker website at tifia.com/analytics


Support and resistance levels

Since the beginning of the week, the GBP / USD pair has grown amid reports of the possibility of a favorable outcome of the Brexit talks. At the beginning of the European session on Tuesday, GBP / USD was trading near the 1.3085 mark. However, in the future, GBP / USD moved to negative territory, trading closer to the opening of the US trading session near the mark of 1.3015.

Starting in May, GBP / USD is traded in a downward channel on the daily chart, the lower limit of which is near 1.2300.

Corrective growth may continue to resistance levels 1.3215 (Fibonacci retracement level of 23.6% of the correction to the GBP / USD decline in the wave, which began in July 2014 near the level of 1.7200), 1.3300 (EMA200 on the daily chart).

Nevertheless, short positions are preferable, a long bearish trend persists, and the GBP / USD pair may fall towards the August and annual lows near the support level of 1.2670, and 1.2365 mark, through which the lower border of the descending channel on the weekly chart is passing.

[b] Support levels: 1.3000, 1.2910, 1.2800, 1.2670, 1.2590, 1.2365

Resistance levels: 1.3085, 1.3100, 1.3215, 1.3300


Trading Scenarios [/b]

Sell Stop 1.2990. Stop-Loss 1.3050. Take-Profit 1.2910, 1.2800, 1.2670, 1.2590, 1.2365

Buy Stop 1.3050. Stop-Loss 1.2990. Take-Profit 1.3100, 1.3215, 1.3300


110918-_GU-_D.png


110918-_GU-_H4.png


*) For up-to-date and detailed analytics and news on the forex market visit Tifia Forex Broker website tifia.com
 
WTI: oil and oil products stocks rose

12/09/2018

Current dynamics


As the American Petroleum Institute (API) reported late Tuesday, oil and oil products stocks fell 8.636 million barrels last week. On the eve of oil prices have been growing on reports of riots in Libya and in connection with the hurricane Florence approaching to the US.

After the publication of the API data, the growth of oil quotes increased.

As a result, a barrel of oil WTI worth at the end of the trading day on Tuesday 69.66 dollars. Since the opening of the trading day on Wednesday, oil prices have remained almost unchanged, and investors are waiting for the publication (at 14:30 GMT) of weekly official data on US stocks from the Energy Ministry of this country. It is expected to reduce inventories by 0.805 million barrels, which should positively affect oil prices.

*)An advanced fundamental analysis is available on the Tifia Forex Broker website at tifia.com/analytics


Support and resistance levels

The price of WTI crude oil remains in an upward trend. While the price is above the key support levels of 66.35 (Fibonacci level of 23.6% of the correction to the wave of growth, which began in June 2017 with the support level near the 42.00 mark), 64.80 (EMA200 and the bottom line of the upward channel on the daily chart), long-term upward dynamics persist .

The nearest growth target is 71.00 (highs of August), through which the upper line of the ascending channel on the daily chart passes.

Support levels: 68.10, 67.00, 66.35, 64.80, 64.15

Resistance levels: 70.00, 71.00, 72.80, 73.85


Trading Scenarios


Sell Stop 68.90. Stop-Loss 70.10. Take-Profit 68.10, 67.00, 66.35, 64.80, 64.15

Buy Stop 70.10. Stop-Loss 68.90. Take-Profit 71.00, 72.80, 73.85


120918-wti-d.png


120918-wti-h4.png


*) For up-to-date and detailed analytics and news on the forex market visit Tifia Forex Broker website tifia.com
 
EUR/USD: Technical Analysis

14/09/2018


Since April 2018, EUR / USD remains within the descending channel on a weekly chart, the lower limit of which is close to the support level of 1.1150. However, at the moment the upward correction continues.

On Thursday, the European Central Bank retained the key interest rate at 0%, and on deposits - at the level of -0.40%. The ECB confirmed its intention to keep interest rates unchanged until the summer of 2019 and lowered its forecasts for GDP growth for 2018 and 2019, from 2.1% to 2.0% and from 1.9% to 1.8%, respectively.

Nevertheless, EUR / USD rose against the background of publication (at 12: 30 GMT) of weak inflationary indicators of the USA.

The dollar index DXY also trades lower, at 94.45 against 94.56 at the opening of the trading day, and EUR / USD at the beginning of the European trading session is trading slightly above the 1.1700 mark.

In case of breakdown of the local resistance level 1.1730 (August highs and EMA200 on the weekly chart), EUR / USD is likely to grow to resistance levels 1.1770 (EMA200 on the daily chart), 1.1790 (Fibonacci level 38.2% of the correction to the fall from the level of 1.3900, which began in May 2014). However, above the resistance level 1.1790, growth is unlikely.

The key interest rate of the Fed is in the range of 1.75% -2% and it will be much higher than the ECB rate by the time the ECB starts its policy tightening cycle.

The difference between interest rates in the US is an important fundamental factor in favor of dollar purchases against the euro.

The breakdown of the important support levels 1.1625 (EMA50 on the daily chart), 1.1605 (EMA200 on the 4-hour chart) will open the way for further decline with a long target at the support level of 1.1150 (the lower boundary of the descending channel on the weekly chart).

*)An advanced fundamental analysis is available on the Tifia Forex Broker website at tifia.com/analytics


Support levels: 1.1660, 1.1625, 1.1605, 1.1535, 1.1510, 1.1400, 1.1345, 1.1285, 1.1150

Resistance levels: 1.1730, 1.1770, 1.1790


Trading Scenarios


Sell Stop 1.1650. Stop-Loss 1.1740. Take-Profit 1.1625, 1.1605, 1.1535, 1.1510, 1.1400, 1.1345, 1.1285, 1.1150

Buy Stop 1.1740. Stop-Loss 1.1650. Take-Profit 1.1770, 1.1790

140918-_EU-_W.png


140918-_EU--_D.png


140918-_EU--_H4.png


*) For up-to-date and detailed analytics and news on the forex market visit Tifia Forex Broker website tifia.com
 
GBP/USD: Brexit will remain the focus of attention

18/09/2018


US President Donald Trump on Monday said that the United States for many years had suffered huge losses in foreign trade, and can not continue like this.

As it became known, the administration of the US President Donald Trump intends to introduce new duties on goods from China worth a total of $ 200 billion. The new tariffs will come into force on September 24 and will be 10%, and by the end of the year they will be raised to 25%. The Chinese authorities reported that they will introduce reciprocal duties on American imports.

European currencies reacted quite restrainedly to this news, as it did not become unexpected.

Last week, the Bank of England kept the interest rate at 0.75%. In the Bank of England's reports, it was noted that Brexit remains the key risk to the British economy. News on Brexit will continue to be in the center of attention of market participants and most strongly influence the dynamics of the pound.

*)An advanced fundamental analysis is available on the Tifia Forex Broker website at tifia.com/analytics


Support and resistance levels

The GBP / USD pair is declining at the beginning of the European trading session, but continues to trade above 1.3100, near the upper line of the rising channel on the daily chart.

Since mid-August, GBP / USD has been developing an upward trend, which can be described as a correction after months of decline. The growth may continue to the levels of resistance 1.3215 (Fibonacci level 23.6% of the correction to the fall of the GBP / USD in the wave, which began in July 2014 near the level of 1.7200), 1.3300 (EMA200 on the daily chart).

Nevertheless, the long-term bearish trend persists, and the GBP / USD pair may decline towards the August and annual lows near the support level of 1.2670 and the lower boundary of the downward channel on the weekly chart passing through the 1.2365 mark.

The breakdown of the local support level 1.3055 will be a signal to resume the decline.

Support levels: 1.3085, 1.3055, 1.3000, 1.2985, 1.2800, 1.2670, 1.2590, 1.2365, 1.2110, 1.2000

Resistance levels: 1.3200, 1.3215, 1.3300


Trading Scenarios


Sell Stop 1.3050. Stop-Loss 1.3175. Take-Profit 1.3000, 1.2974, 1.2800, 1.2670, 1.2590, 1.2365, 1.2110, 1.2000

Buy Stop 1.3175. Stop-Loss 1.3050. Take-Profit 1.3200, 1.3215, 1.3300


180918-_GU--_D.png


180918-_GU--_W.png


*) For up-to-date and detailed analytics and news on the forex market visit Tifia Forex Broker website tifia.com
 
Back
Top