Tifia Forex Broker Daily Market Analytics, Analytics and trading recommendations by Tifia Company

GBP/USD: macro statistics remain in the background

01/22/2019

Current dynamics


British Prime Minister Theresa May on Monday presented her new plan for secession from the European Union, which is very similar to the previous one.

The leader of the Labor Party of Great Britain, Jeremy Corbin, said that "it really starts to sound like something like Groundhog Day" and called for a vote in the House of Commons on the second Brexit referendum.

In Brussels, it was repeatedly repeated that the transaction could not be subjected to significant changes. "This withdrawal agreement cannot be changed", said Irish Foreign Minister Simon Coveney on Monday.

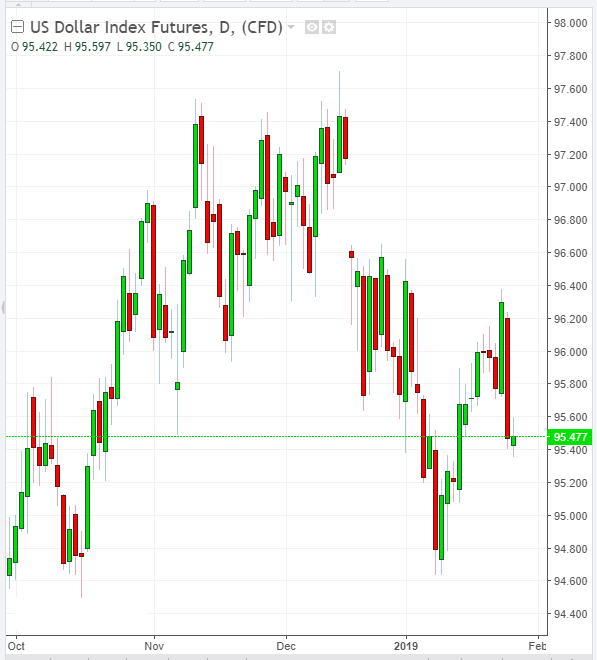
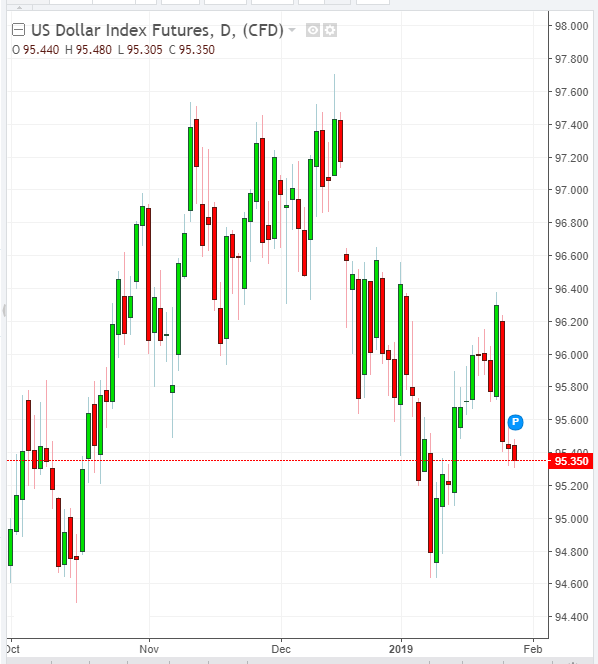
It seems that the situation again comes to a standstill, and the likelihood of "hard" Brexit is growing every day. This puts pressure on the pound, not allowing the uptrend to develop above the key resistance levels of 1.2955, 1.3030.

According to the data of the National Bureau of Statistics of the United Kingdom published on Tuesday, the number of employed citizens in the period from September to November increased by 141,000 compared with the previous three-month period, while the employment rate reached a record 75.8%.

The Bank of England expects that a decrease in free resources in the labor market will contribute to wage growth and keeping inflation above the target level in the coming years. However, until the situation with Brexit is resolved, the Bank of England will remain neutral in relation to changes in monetary policy, despite the high inflation rate in the country after the Brexit referendum held in June 2016.

*)An advanced fundamental analysis is available on the Tifia Forex Broker website at tifia.com/analytics


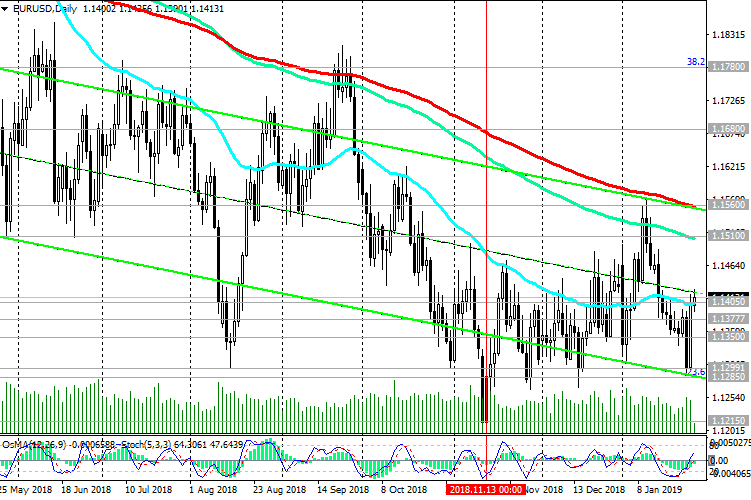
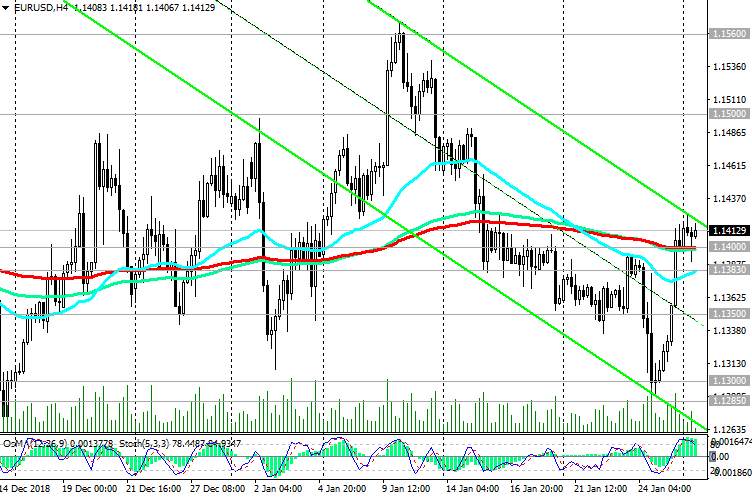
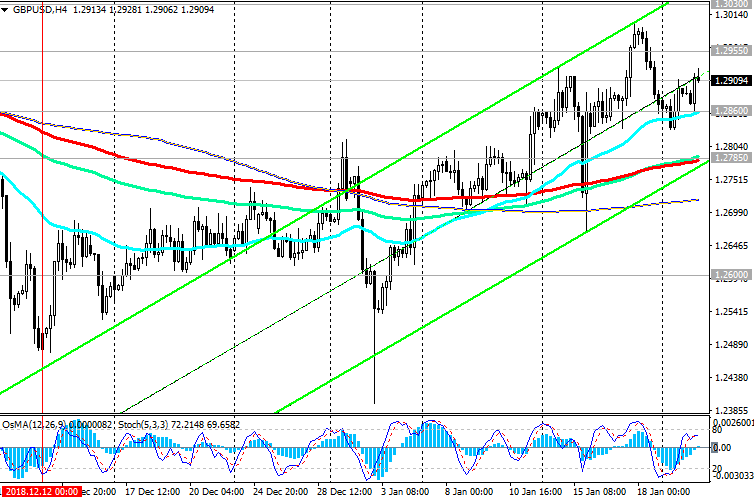
Despite the failure of the Brexit vote in the British parliament, GBP / USD continues to develop an upward correction, trading above the important short-term support levels of 1.2860 (ЕМА200 on the 1-hour chart), 1.2785 (ЕМА200 on the 4-hour chart).

However, GBP / USD remains below key resistance levels of 1.2955 (EMA144 on the daily chart), 1.3030 (EMA200 on the daily chart).

Above the resistance level of 1.3030, GBP / USD growth is unlikely. The pound remains under pressure due to the domestic political crisis in the UK and Brexit.

In the event of a breakdown of the support level of 1.2785, the GBP / USD will go into the downstream channels on the daily and weekly charts to the support levels of 1.2600 (June 2017 lows), 1.2485, 1.2365. The main trend is still bearish. Below the key resistance levels of 1.3210 (Fibonacci 23.6% of the correction to the decline of the GBP / USD pair in the wave that started in July 2014 near 1.7200), 1.3030 (ЕМА200 on the daily chart) negative dynamics prevail and short positions are preferable.

Support Levels: 1.2860, 1.2785, 1.2700, 1.2670, 1.2600, 1.2485, 1.2365, 1.2110, 1.2000

Resistance Levels: 1.2955, 1.3030, 1.3125, 1.3210, 1.3300, 1.3470, 1.3740


Trading recommendations


Sell in the market. Stop Loss 1.3040. Take-Profit 1.2860, 1.2785, 1.2700, 1.2670, 1.2600, 1.2485, 1.2365

Buy Stop 1.2930. Stop Loss 1.2850. Take-Profit 1.2955, 1.3030

220119-GU-D.png


220119-GU-H4.png


*) For up-to-date and detailed analytics and news on the forex market visit Tifia Forex Broker website tifia.com
 
NZD/USD: New Zealand dollar strengthened on Wednesday

01/23/2019

Current Dynamics


As the Statistics Bureau of New Zealand reported on Wednesday, in the 4th quarter of 2018, consumer prices increased by 0.1% compared to the 3rd quarter, and the annual increase in consumer prices was 1.9%. The forecast was 0% and + 1.8%, respectively.

At the same time, as noted by the Bureau of Statistics, the increase in prices for domestic goods turned out to be quite high, reaching 0.7% compared with the previous quarter (the forecast was + 0.4%). The annual increase in prices for these goods was 2.7%.

According to economists, the published data give reason to expect further growth in domestic inflation. This is a positive factor for the New Zealand currency, as talk about the possibility of lowering the rate of the RBNZ in February subsided.

The New Zealand dollar rose after the publication of data on inflation, and the NZD / USD pair jumped to the level of 0.6800, through which the strong resistance level passes (200-period moving average on the daily chart).

Nevertheless, one should not expect a stronger strengthening of the New Zealand dollar.

Economists continue to point out signs of slowing economic growth and stick to the previous forecast, suggesting that the RBNZ will lower its key interest rate in 2019. But even if this does not happen, the need to raise interest rates will not arise soon. And this is a constraining fundamental factor for the further strengthening of the New Zealand currency.

The slowdown in the growth of the Chinese economy and the decline in imports to China represents a direct threat to the New Zealand economy, which can be expressed in a decline in the volume of export earnings and the level of New Zealand GDP. Nevertheless, the New Zealand dollar so far remains stable, despite the deterioration of the international trading environment.

Meanwhile, the US dollar is moderately declining on Wednesday. The DXY dollar index, which tracks the US currency against a basket of 6 other major currencies, has grown over the past four trading days by 1.0%, exceeding the 96.00 mark. However, on Wednesday, DXY futures traded near the 95.88 mark, while maintaining a long-term positive trend.

*)An advanced fundamental analysis is available on the Tifia Forex Broker website at tifia.com/analytics


Trading scenarios

Since the beginning of the month, NZD / USD has been growing, attempting to consolidate above the key level of 0.6800 (ЕМА200 on the daily chart). The breakdown of the strong resistance level of 0.6860 (Fibonacci level 23.6% of the upward correction to the global wave of the pair's decline from the level of 0.8800, started in July 2014; the lows of the wave are near the level of 0.6260) could mean breaking the bearish trend of NZD / USD, which began in April 2018. In this case, NZD / USD will go towards the resistance level of 0.7100 (ЕМА200 on the weekly chart).

An alternative scenario will be associated with the breakdown of the support level of 0.6765 (EMA144 on the daily chart and EMA200 on the 4-hour chart), which confirms the return of NZD / USD to a bearish trend.

Below the support level of 0.6765 (EMA200 on the 4-hour chart) short positions are again preferred.

Support levels: 0.6765, 0.6708, 0.6655, 0.6515, 0.6430

Resistance levels: 0.6800, 0.6860, 0.6970, 0.7100


Trading Scenarios


Sell Stop 0.6760. Stop Loss 0.6810. Take-Profit 0.6710, 0.6655, 0.6515, 0.6430

Buy Stop 0.6810. Stop Loss 0.6760. Take-Profit 0.6860, 0.6970, 0.7000, 0.7100

230119-DXY.png


230119-NU-D.png


230119-NU-H4.png


*) For up-to-date and detailed analytics and news on the forex market visit Tifia Forex Broker website tifia.com
 
EUR/USD: Support and Resistance Levels

24/01/2019


The focus of traders today is the ECB meeting and its decision on the interest rate and the QE program. The ECB's decision on interest rates will be published at 12:15 (GMT), and the ECB press conference will begin at 13:30. The ECB is likely to keep current key interest rates unchanged today. The basic interest rate will remain at the same level of 0%; the ECB deposit rate for commercial banks is also likely to remain unchanged at -0.4%. If the ECB head Mario Draghi again signals the extension or expansion of the QE program, the fall of the Eurodollar will be even stronger.

The immediate targets for the decline are support levels of 1.1300, 1.1285 (Fibonacci level 23.6% of the correction to the fall from 1.3900, which began in May 2014), 1.1270 (December lows), 1.1215 (November and year lows). Negative dynamics prevail.

The alternative scenario assumes the resumption of correctional growth with targets at resistance levels of 1.1510, 1.1560 (EMA200 on the daily chart). In this case, the breakdown of the short-term resistance level of 1.1405 will be a signal for the implementation of this scenario.

*)An advanced fundamental analysis is available on the Tifia Forex Broker website at tifia.com/analytics


Support Levels: 1.1300, 1.1285, 1.1215, 1.1120, 1.1000

Resistance Levels: 1.1392, 1.1405, 1.1510, 1.1560, 1.1680, 1.1780


Trading recommendations


Sell in the market. Stop-Loss 1.1410. Take-Profit 1.1300, 1.1285, 1.1215, 1.1120

Buy Stop 1.1410. Stop-Loss 1.1330. Take-Profit 1.1510, 1.1560

210119-EU-D.png


210119-EU-H4.png


*) For up-to-date and detailed analytics and news on the forex market visit Tifia Forex Broker website tifia.com
 
WTI: Market Expectations

25/01/2019


The oil market traders seem to be confused due to a number of conflicting fundamental factors. The acute political crisis in Venezuela, which has the world's largest oil reserves on the one hand, and the growth of commercial oil reserves in the United States last week, as well as ongoing trade conflicts and a slowdown in the global economy, on the other hand, create multidirectional oil price vectors.

On Friday (19:00 GMT), a weekly report from the American oilfield services company Baker Hughes on the number of active oil drilling rigs in the United States will be published. Their number declined again in the previous week and currently stands at 852 units against the maximum of 887 units reached at the end of 2018. However, there is a recovery in oil prices after falling in the 4th quarter of 2018 (oil prices in the end of December hit bottom near the mark of 42.00 dollars per barrel of WTI crude oil). Rising oil prices create an incentive for American oil companies to increase production, which, in turn, is a deterrent to rising oil prices. The increase in the number of drilling rigs is a negative factor for oil prices.

WTI crude oil prices reached important resistance levels near $ 52.75 per barrel (ЕМА50 on the daily chart, upper line of the downward channel on the daily chart).

OsMA and Stochastic indicators on the 1-hour, 4-hour, daily charts recommend short positions.

Returning to the zone below 52.75 creates the risk of a resumption of the bearish trend that began in early October 2018.

Also, in the current price dynamics it is possible to distinguish a range with upper and lower lines passing through the marks 54.10, 50.25. Exit from this range can also determine the direction of further price movement.

*)An advanced fundamental analysis is available on the Tifia Forex Broker website at tifia.com/analytics


Support Levels: 52.00, 51.60, 50.25, 50.00, 49.00, 46.00, 42.20

Resistance Levels: 52.75, 54.10, 57.00, 57.80, 58.50, 60.00


Trading scenarios


Sell Stop 51.50. Stop Loss 54.20. Take-Profit 50.00, 49.00, 46.00, 42.00

Buy Stop 54.20. Stop Loss 51.50. Take-Profit 55.30, 56.60, 57.00, 57.80, 58.50, 59.40, 60.00


250119-WTI-H4.png


250119-WTI-D.png


250119-WTI-W.png


*) For up-to-date and detailed analytics and news on the forex market visit Tifia Forex Broker website tifia.com
 
EUR/USD: an important week for the dollar has begun

01/28/2019

Current situation


The focus of traders on the new week began will be the Fed meeting, the publication of data from the US labor market in January, as well as a vote in the British parliament on option "B" of the Brexit deal.

After the last ECB meeting on Thursday, investors were convinced that the ECB will not raise rates in the coming months and, as a maximum, until mid-2020.

The ECB left its interest rates and monetary policy unchanged, and the head of the ECB, Mario Draghi, reported the prevalence of downside risks to the Eurozone economy.

At the same time, the USA also faces problems of domestic and foreign economic nature.

Partial suspension of the US government has had a negative impact on consumer and producer sentiment indicators. It is also likely that the suspension of the work of state institutions had a negative impact on the growth of the US economy in the 1st quarter of 2019.

Last week, the dollar index DXY, reflecting its value against a basket of 6 currencies, fell by 0.5% to 95.50.

Probably, the Fed will not change its monetary policy at a meeting to be held on Tuesday and Wednesday. This will support the US stock markets, but may adversely affect the dollar quotes.

*)An advanced fundamental analysis is available on the Tifia Forex Broker website at tifia.com/analytics


Trading scenarios

Meanwhile, the EUR / USD holds positions reached last Friday near the important level of 1.1400 (ЕМА200 on the 4-hour chart, ЕМА50 on the daily chart).

Indicators OsMA and Stochastic on the 1-hour, 4-hour, daily charts recommend long positions.

In the current situation, long positions with targets at resistance levels of 1.1500 (EMA144 on the daily chart), 1.1560 (EMA200 on the daily chart) look preferable.

The alternative scenario assumes a resumption of the decline. The signal for the development of this scenario will be the breakdown of support levels 1.1400, 1.1383 (ЕМА200 on 1-hour chart) with targets at support levels 1.1300, 1.1285 (Fibonacci level 23.6% of the correction to the fall from 1.3900 level, started in May 2014), 1.1270 (December lows), 1.1215 (November and year lows).

Support Levels: 1.1400, 1.1383, 1.1350, 1.1300, 1.1285, 1.1215, 1.1120, 1.1000

Resistance Levels: 1.1500, 1.1560, 1.1680, 1.1780


Trading scenarios


Sell Stop 1.1375. Stop-Loss 1.1430. Take-Profit 1.1350, 1.1300, 1.1285, 1.1215, 1.1120

Buy Stop 1.1430. Stop-Loss 1.1375. Take-Profit 1.1500, 1.1560

280119-dxy.png


280119-EU-D.png


280119-EU-H4.png


*) For up-to-date and detailed analytics and news on the forex market visit Tifia Forex Broker website tifia.com
 
USD/CHF: dollar is under pressure

Current dynamics

01/29/2019


The dollar is moderately declining on Tuesday. The DXY dollar index, which tracks the US currency against a basket of 6 other major currencies, has been falling since the opening of today's trading day. At the beginning of the European trading session, futures for the DXY index traded near the 95.35 mark, 9 points lower than the opening price of the trading day.

On Tuesday, investors will wait for the outcome of the vote in the British Parliament on the plan "B" about Brexit, and on Wednesday - the outcome of the meeting of the US Federal Reserve.

Probably, the Fed will keep the current monetary policy unchanged. If Fed Chairman Jerome Powell again signals a cautious approach to further tightening the Fed’s monetary policy, the dollar will be under pressure. Conversely, Powell’s harsh rhetoric will support the dollar.

*)An advanced fundamental analysis is available on the Tifia Forex Broker website at tifia.com/analytics


At the same time, signals appeared to continue the decline of the pair USD / CHF.

Indicators OsMA and Stochastic on the daily chart moved to the side of sellers.

A breakout of the important short-term support level of 0.9910 (ЕМА200 on the 4-hour chart) will confirm a decline signal with targets at the support levels of 0.9875 (ЕМА200 on the daily chart), 0.9765 (ЕМА200 on the weekly chart), 0.9745 (Fibonacci 50% of the upward correction to the last global the wave of decline since December 2016 and from the level of 1.0300), 0.9720 (January lows).

The breakdown of the resistance level of 0.9930 (ЕМА200 on the 1-hour chart) will return the USD / CHF momentum for further growth. Above the support level of 0.9875, long-term positive dynamics of USD / CHF remains.

Support levels: 0.9910, 0.9875, 0.9800, 0.9765, 0.9745, 0.9720, 0.9650, 0.9615, 0.9545

Resistance Levels: 0.9930, 0.9970, 0.9990, 1.0040, 1.0090, 1.0130


Trading Scenarios


Sell Stop 0.9890. Stop Loss 0.9940. Take-Profit 0.9875, 0.9800, 0.9765, 0.9745, 0.9720, 0.9650, 0.9615, 0.9545

Buy Stop 0.9940. Stop Loss 0.9890. Take-Profit 0.9970, 0.9990, 1.0040, 1.0090, 1.0130

290119-dxy.png


290119-UCF-D.png


290119-UCF-H4.png


*) For up-to-date and detailed analytics and news on the forex market visit Tifia Forex Broker website tifia.com
 
AUD/USD: Market Expectations

30/01/2019


In December, US Federal Reserve Chairman Jerome Powell announced the central bank’s intention to be patient this year in deciding to raise interest rates, taking into account the turbulence seen in financial markets over the past few weeks about the problems of global economic growth. “The US economy is strong”, said Powell. “The main source of concern is global growth”.

If Jerome Powell again signals a cautious approach to further tightening the Fed’s monetary policy, the dollar will be under pressure. Powell’s harsh rhetoric, which is less likely, will support the dollar.

According to the quotations of futures on the Fed's rates, investors estimate the probability of a rate hike in the current year at 18%.

The Fed's decision will be published on Wednesday at 19:00 (GMT), and the Fed’s press conference will begin at 19:30.

At the same time, the Australian dollar received support today after, during the Asian session, the Australian Bureau of Statistics reported a rise in Australia's consumer price index (CPI) in the 4th quarter by 0.5% compared with the previous quarter, and by 1,8% in annual terms (the forecast was +0.4% +1.7%, respectively).

*)An advanced fundamental analysis is available on the Tifia Forex Broker website at tifia.com/analytics


In general, the long-term bearish trend AUD / USD is still in force. In the long run, short positions are preferable. The reached local maxima near the 0.7200 mark probably provide a good opportunity to enter a short position on AUD / USD.

Breakdown of the support level 0.7150 (ЕМА200 on the 4-hour chart, ЕМА50 on the daily chart) will return AUD / USD to the inside of the descending channel on the daily chart and will cause the resumption of decline with long-term goals at support levels of 0.6910 (lows of September 2015), 0.6830 (2016 lows).

Below support level 0.7150, short positions are preferable.

An alternative scenario, implying the development of an upward correction, suggests an increase in AUD / USD to resistance levels of 0.7245 (ЕМА144 on the daily chart), 0.7295. Above the resistance level of 0.7295 AUD / USD growth is unlikely.

Support Levels: 0.7150, 0.7100, 0.7085, 0.7025

Resistance Levels: 0.7200, 0.7245, 0.7295, 0.7385, 0.7460


Trading scenarios


Sell in the market. Stop Loss 0.7210. Take-Profit 0.7150, 0.7100, 0.7085, 0.7025, 0.6910, 0.6830

Buy Stop 0.7210. Stop Loss 0.7140. Take-Profit 0.7245, 0.7295, 0.7385, 0.7460

300119-dxy.png


300119-AU-D.png


300119-AU-H4.png


*) For up-to-date and detailed analytics and news on the forex market visit Tifia Forex Broker website tifia.com
 
EUR/USD: the dollar fell after the Fed decision

01/31/2019

Current situation


At the regular meeting the ECB last Thursday kept its current monetary policy unchanged. ECB President Mario Draghi reported on the prevalence of downside risks for the Eurozone economy, including protectionism in international trade and geopolitical tensions. Earlier, the central bank noted a general balance of risks.

Last Wednesday, the Fed also did not change its monetary policy, maintaining interest rates at the same level.

The cautious position of the US Federal Reserve and the statements of its head Jerome Powell that "the arguments in favor of raising rates have weakened a bit", raised the EUR / USD to a 3-week high near the 1.1515 mark.

Powell reiterated that future policy will be “completely dependent on data”.

Market participants expect the Fed will not raise rates this year.

Now, after the statements of Powell, data from the US labor market, expected on Friday, will attract increased attention of market participants. Data worse than the forecast values and data for December will weaken the likelihood of further tightening of monetary policy and adversely affect the dollar quotes.

From the news today it is worth paying attention to the publication (from 13:30 to 15:00 GMT) of US macro data: data on unemployment applications last week and sales of new homes in November. Positive macro data will provide short-term support for the dollar. Conversely, weak data will adversely affect the dollar quotes and support the EUR / USD pair, which is falling on Thursday after the publication of the weaker-than-expected 4-quarter Eurozone GDP data. According to Eurostat, in the 4th quarter, Eurozone GDP grew by +0.2% (+1.2% in annual terms). Thus, the GDP growth in the Eurozone in 2018 was 1.8% versus 2.4% in 2017. The data again indicate a slowdown in the European economy in 2018.

*)An advanced fundamental analysis is available on the Tifia Forex Broker website at tifia.com/analytics


Trading scenarios

Meanwhile, the EUR / USD holds positions reached last Thursday near an important resistance level of 1.1500 (EMA144 on the daily chart).

The OsMA and Stochastic indicators on the 4-hour, daily charts still recommend long positions.

In the current situation, long positions with targets at resistance levels of 1.1500 (EMA144 on the daily chart), 1.1550 (EMA200 on the daily chart) look preferable.

The alternative scenario assumes a resumption of the decline. The signal for the development of this scenario will be the breakdown of support levels 1.1418 (ЕМА200 on the 1-hour chart), 1.1410 with targets at support levels 1.1300, 1.1285 (Fibonacci level 23.6% of the correction to the fall from 1.3900 level, which began in May 2014), 1.1270 (December lows), 1.1215 (November and year lows).

Support Levels: 1.1418, 1.1410, 1.1350, 1.1300, 1.1285, 1.1215, 1.1120

Resistance Levels: 1.1500, 1.1550, 1.1680, 1.1780


Trading scenarios


Sell Stop 1.1460. Stop Loss 1.1510. Take-Profit 1.1410, 1.1350, 1.1300, 1.1285, 1.1215, 1.1120

Buy Stop 1.1510. Stop-Loss 1.1460. Take-Profit 1.1550, 1.1680, 1.1780

310119-DXY.png


310119-EU-D.png


310119-EU-H4.png


*) For up-to-date and detailed analytics and news on the forex market visit Tifia Forex Broker website tifia.com
 
XAU/USD: on the eve of NFP publication

01/02/2019


The dollar is falling on Friday, and gold quotes continue to rise. Investors are waiting for publication (at 13:30 GMT) data from the US labor market in January. These data (along with data on GDP and inflation) are crucial for the central bank, including the Fed, in determining the direction and pace of monetary policy.

Strong performance is expected, despite the fact that the number of new jobs in the non-agricultural sector of the US economy in January increased by 165,000 (after a growth in the same period in December by 312,000). The growth in the number of jobs above 150,000 per month is a good indicator. At the same time, unemployment will remain at the lowest levels for many years (3.9%).

If the data is confirmed, the dollar may receive short-term support and strengthen. More important for the further dynamics of the dollar and the price of gold is that the Fed has signaled a pause in the process of further raising interest rates. Last Wednesday, the Fed kept the current monetary policy unchanged, and Fed Chairman Jerome Powell said that "there was a little less reason to raise rates", and future policies would "completely depend on data".

A more cautious monetary policy of the Fed, as well as in a situation of worsening growth prospects for the world economy and international trade conflicts, political struggle in Washington, attenuation of fiscal stimulus will help to maintain the demand for gold and the continued growth of its quotes.

However, during the publication of data from the US labor market, a surge in volatility is expected in trading across the entire financial market. Probably more cautious investors would prefer to stay out of the market during this time period.

*)An advanced fundamental analysis is available on the Tifia Forex Broker website at tifia.com/analytics


Meanwhile, the XAU / USD pair is trading near multi-month highs and a mark of 1320.00, through which the upper line of the ascending channel on the daily chart passes. There is a strong positive impulse, and in case of continued growth, the targets are resistance levels of 1357.00 (2017 highs), 1370.00 (start of a decline wave and Fibonacci level 100%), 1375.00 (2016 highs).

An alternative scenario involves the breakdown of support levels of 1283.00 (EMA200 on the 4-hour chart), 1277.00 and the resumption of the bearish gold trend.

Below the support level of 1255.00 short positions will become preferable again.

So far, long positions are preferred.

Support Levels: 1305.00, 1283.00, 1277.00, 1265.00, 1255.00, 1248.00, 1234.00, 1220.00, 1197.00, 1185.00, 1160.00

Resistance Levels: 1327.00, 1357.00, 1365.00, 1370.00, 1375.00


Trading scenarios


Sell Stop 1297.00. Stop Loss 1307.00. Take-Profit 1283.00, 1277.00, 1265.00, 1255.00, 1248.00, 1234.00, 1220.00, 1197.00, 1185.00, 1160.00

Buy Stop 1328.00. Stop Loss 1304.00. Take-Profit 1357.00, 1365.00, 1370.00, 1375.00


010219-DXY.png


010219-XU-W.png


010219-XU-D.png


*) For up-to-date and detailed analytics and news on the forex market visit Tifia Forex Broker website tifia.com
 
AUD/USD: RBA will keep current interest rate. Trading scenarios

04/02/2019


The US dollar is trading higher on Monday, and the DXY dollar index futures at the beginning of the European session is at 95.46, 12 points higher than the opening price of the trading day.

As reported last Friday by the US Department of Labor, the number of non-agricultural jobs increased by 304,000 in January, while the average hourly wage in the private sector increased by 3.2% from the previous year. The forecast was +170,000 jobs. Despite the fact that unemployment rose to 4% from 3.9%, it still remains at its lowest level in the last 10 years. Investors considered the report to be generally positive, which gave the US dollar an impetus for further growth.

At the same time, the AUD / USD is falling from the opening of the trading day on Monday and at the beginning of the European trading session, trading near the 0.7230 mark.

On Tuesday, the attention of traders will be directed to the publication at 03:30 (GMT) of the decision on the RBA interest rate. It is expected that the central bank of Australia will leave its key interest rate unchanged, at a record low of 1.5%. Market participants will closely monitor the rhetoric of the RBA's accompanying statement.

The fall in housing prices, the slowdown in consumer spending, weak wage growth, the trade conflict between the United States and China, and the uncertain prospects for the global economy have become factors in the slowdown in GDP growth in 2019.

Any concerns of the RBA leadership regarding the growth of the country's economy can be considered by investors as a signal to resume sales of the Australian dollar.

*)An advanced fundamental analysis is available on the Tifia Forex Broker website at tifia.com/analytics


Meanwhile, AUD / USD is declining, attempting to consolidate below the support level of 0.7245 (EMA144 on the daily chart).

In the event of a breakdown of short-term support levels of 0.7204 (EMA200 on the 1-hour chart), 0.7172 (EMA200 on the 4-hour chart, EMA50 on the daily chart) AUD / USD will move towards the support levels of 0.7085, 0.7025 with the prospect of further decline with long-term goals at the levels support 0.6910 (lows of September 2015), 0.6830 (lows of 2016).

An alternative scenario assumes the resumption of upward correction. In case of a breakdown of the key resistance level of 0.7295 AUD / USD, it will go to resistance levels of 0.7385, 0.7460 (Fibonacci 23.6% of the correction to the wave of decline in the pair from July 2017 and the level of 0.9500. The minimum of this wave is near the level of 0.6830).

Further growth is unlikely due to a number of fundamental factors.

Support Levels: 0.7204, 0.7172, 0.7085, 0.7025

Resistance Levels: 0.7245, 0.7295, 0.7385, 0.7460


Trading scenarios


Sell in the market. Stop Loss 0.7280. Take-Profit 0.7204, 0.7172, 0.7085, 0.7025, 0.6910, 0.6830

Buy Stop 0.7305. Stop Loss 0.7240. Take-Profit 0.7385, 0.7460


040219-dxy.png


040219-AU-D.png


040219-AU-H4.png


*) For up-to-date and detailed analytics and news on the forex market visit Tifia Forex Broker website tifia.com
 
Back
Top