Tifia Forex Broker Daily Market Analytics, Analytics and trading recommendations by Tifia Company

S&P500: The threat of a nearly 10-year bull trend breaking down is high

12/27/2018

Current situation


On Wednesday, US stock indexes showed a sharp increase after falling for 4 consecutive sessions before.

DJIA rose 1086 points, or 5%, to 22878 points, which in percentage terms was the most significant one-day increase since March 2009. S&P500 added 5%, while the Nasdaq Composite rose 5.8%.

On Tuesday, US financial markets were closed due to the celebration of Catholic Christmas, while most European markets on Wednesday were still closed due to Boxing Day. On Monday, the DJIA and S&P500 fell by 2.5%, and on Wednesday the DJIA declined at the opening of the trading day to around 21620, losing more than 1,800 points in four sessions. At the opening of the trading day on Wednesday, futures on the S&P500 stood at 2333.0, however, it increased during the day, closing the trading day on Wednesday at 2467.0.

Financial markets continue to be feverish at the end of the year. Investors were nervous about the rising interest rates of the Federal Reserve and the US-China trade conflict. Also on the dynamics of stock markets and the dollar in recent days reflected the continuing criticism of the Fed and its head Powell by US President Donald Trump, as well as the uncertainty associated with the closure of the US government.

On Wednesday, Kevin Hasset, Chairman of the Council of Economic Advisers at the White House, said there was no likelihood of the dismissal of Fed Chairman Jerome Powell, despite criticism of the central bank by President Donald Trump. The recovery of stock market quotes and the dollar on Wednesday also was helped by the positive macro data, according to which, retail sales in the US excluding cars for the period from November 1 to December 24 increased by 5.1% compared with the same period of the previous year, which was the most significant increase in six years.

On Thursday, investors' pessimism returns to the markets. US stock indexes are falling. All 11 sectors of the S&P500 are moving towards ending the year with losses, for the first time since 2008. The threat of breaking a nearly 10-year bull trend is higher than ever before.

*)An advanced fundamental analysis is available on the Tifia Forex Broker website at tifia.com/analytics


Support and Resistance Levels

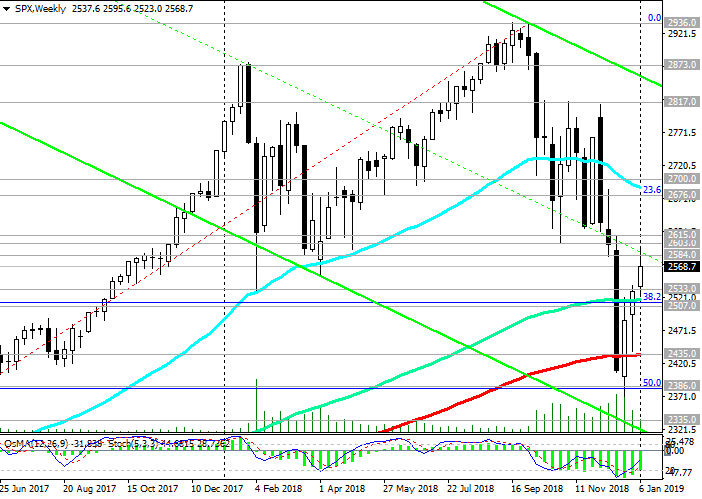
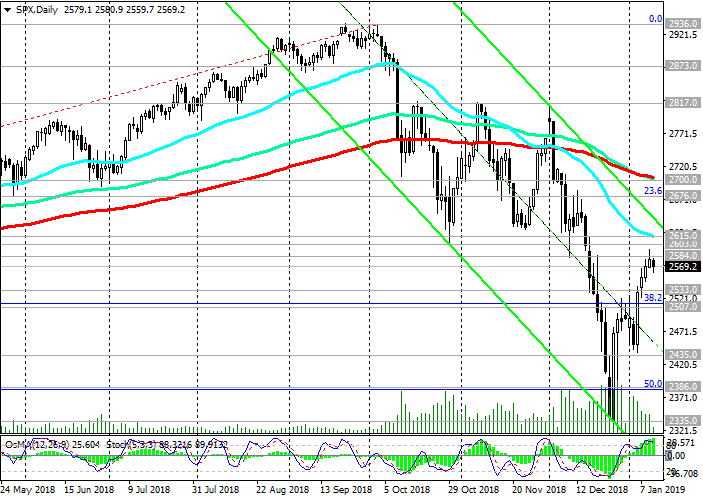
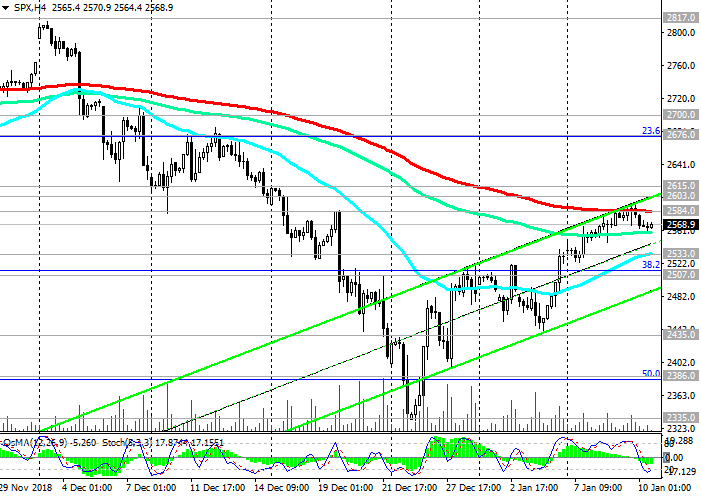
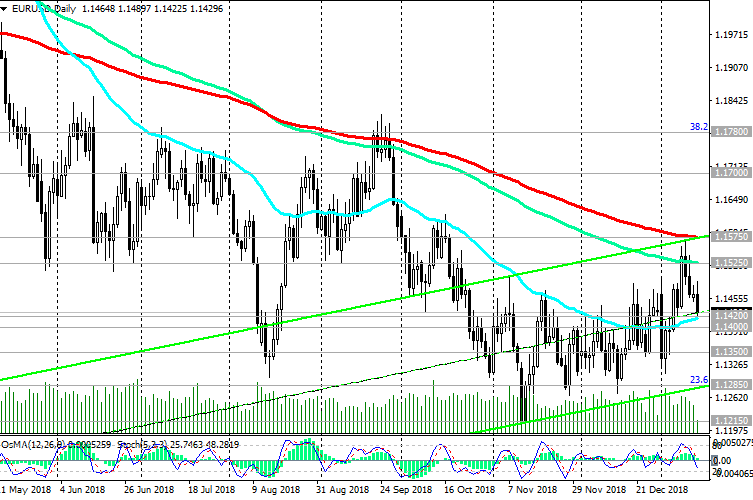
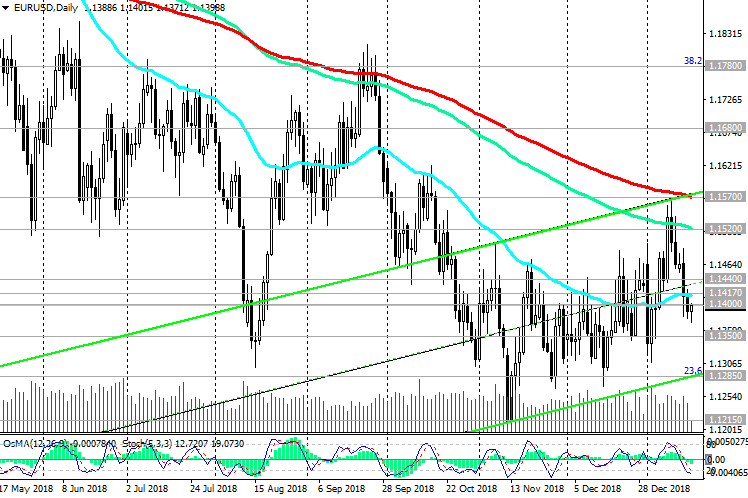
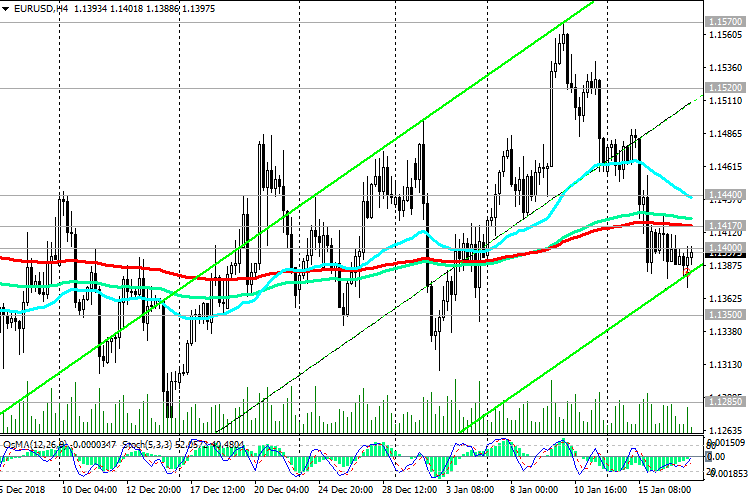
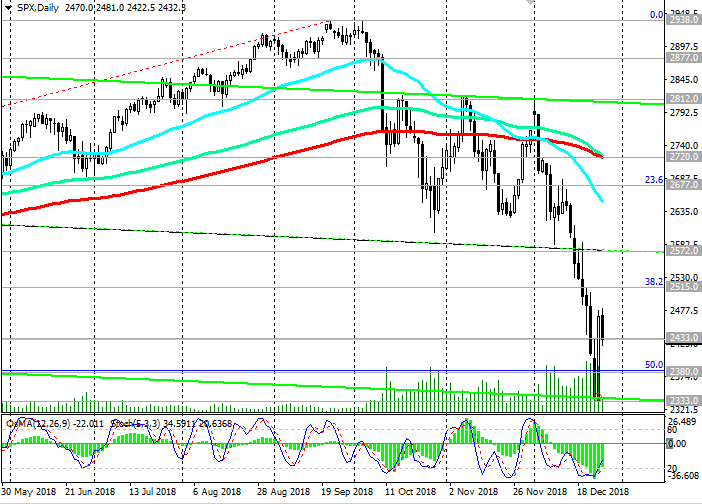
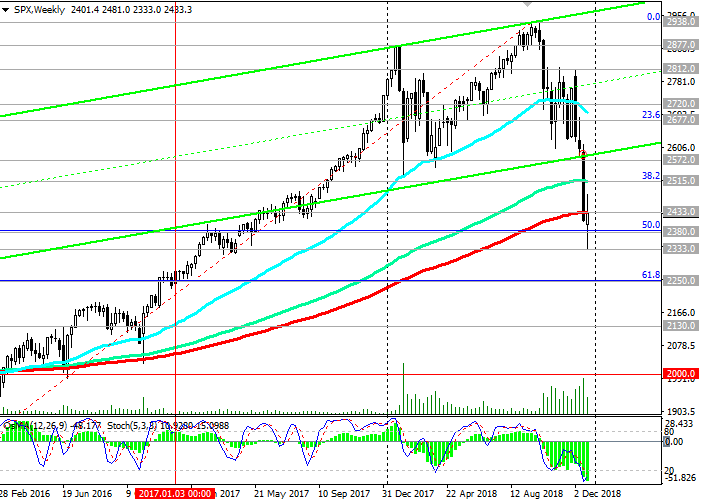
In October, the S&P500 rose to an absolute maximum near the 2938.0 mark. However, a sharp decline in the index began later. Having broken through the strong support levels of 2720.0 (ЕМА200 on the daily chart), 2677.0 (Fibonacci 23.6% of the correction to the growth since February 2016), the S&P500 reached a local minimum near 2333.0 on Wednesday. The last time near this mark S&P500 was in May 2017.

Negative dynamics and pessimism of investors still prevail. On Thursday, the S&P500 declined again after rising the previous day, trading at a key support level of 2433.0 (ЕМА200 on the weekly chart). Fixing below the support level of 2380.0 (Fibonacci level 50%) and a further decline will speak about breaking the bullish trend of the S&P500.

Only after returning to the zone above the resistance level of 2720.0, it will be possible to talk about the resumption of the bull trend. In the current situation, short positions are preferred.

Support Levels: 2433.0, 2380.0, 2333.0, 2250.0, 2130.0

Resistance Levels: 2515.0, 2572.0, 2677.0, 2720.0, 2812.0, 2877.0, 2900.0, 2938.0


Trading Scenarios


Sell Stop 2410.0. Stop Loss 2490.0. Goals 2380.0, 2333.0, 2250.0, 2130.0

Buy Stop 2490.0. Stop-Loss 2410.0. Goals 2515.0, 2572.0, 2677.0, 2720.0, 2812.0, 2877.0, 2900.0, 2938.0

271218-s500-D.png


271218-s500-W.png


*) For up-to-date and detailed analytics and news on the forex market visit Tifia Forex Broker website tifia.com
 
WTI: Support and Resistance Levels

09/01/2019


After in October, the price of WTI oil reached a multi-month and annual maximum near the mark of 76.80 dollars per barrel, then its sharp decline began.

In November, the WTI oil price broke the long-term bullish trend, breaking through the key support levels of 63.50 (Fibonacci 38.2% of the correction to the growth wave that began in February 2016 with the support level near the 27.30 mark), 56.50 (ЕМА200 on the weekly chart) . At the end of last month, the price reached a local and annual minimum near the mark of 42.00 dollars per barrel.

From this level there was a rebound, and the price tried to develop an upward trend.

At the moment, corrective growth has stopped near the local resistance level of 50.50 (ЕМА200 on the 4-hour chart).

A signal for further growth will be the breakdown of this resistance level of 50.50. Medium-term growth targets are resistance levels of 59.40 (Fibonacci level 50%), 60.50 (ЕМА200 on the daily chart).

The breakdown of the short-term support level of 47.80 (ЕМА200 on the 1-hour chart) will return the prices of WTI crude oil to a bearish trend that began in October, with a target at the support level of 42.00 (Fibonacci 100% and the minimums of 2018 and 2017).

*)An advanced fundamental analysis is available on the Tifia Forex Broker website at tifia.com/analytics


Support Levels: 49.00, 47.80, 46.00, 44.50, 42.00

Resistance Levels: 50.50, 52.70, 55.30, 56.50, 59.40, 60.50, 63.50


Trading Scenarios


Sell Stop 48.80. Stop Loss 51.10. Take-Profit 47.80, 46.00, 44.50, 42.00

Buy Stop 51.10. Stop Loss 48.80. Take-Profit 52.70, 55.30, 56.50, 59.40, 60.50, 63.50

090119-WTI-W.png


090119-WTI-D.png


090119-WTI-H4.png


*) For up-to-date and detailed analytics and news on the forex market visit Tifia Forex Broker website tifia.com
 
S&P500: Optimism returns to stock market

10/01/2019

Current situation


Published on Wednesday, the minutes of the December Fed meeting, hinting that the next increase in interest rates in the United States can take place not soon. The protocols showed that Fed leaders are concerned about the slowdown in global economic growth and the tension in trade relations, which destabilized markets before the December meeting. Therefore, "the extent and timing of further policy tightening has become less certain than before".

On Friday, Powell hinted that the Fed could be more patient with raising rates. Jerome Powell said that the central bank is ready to "change" its policy "if necessary" and that it will listen carefully to the market.

Powell’s statement supported investors, and US stock markets have grown in recent days.

There is still a long way to full recovery, but investors' optimism is gradually returning to the stock markets.

On Thursday, investors are expecting speeches by Fed Chairman Jerome Powell at a meeting of the Economic Club in Washington, which will begin at 17:00 (GMT). If Powell repeats his Friday statement, then stock indexes will rise. If Powell changes his mind and his Friday statement, then investors may consider this a negative signal.

*)An advanced fundamental analysis is available on the Tifia Forex Broker website at tifia.com/analytics


Support and resistance levels

In the last days of last year, the S&P500 attempted to recover from a multi-week drop. Nevertheless, the correctional growth of the S&P500 stopped near the resistance level of 2584.0 (EMA200 on the 4-hour chart).

The breakdown of the resistance level of 2584.0 will trigger further growth of the S&P500 with targets at resistance levels of 2603.0, 2615.0 (EMA50 on the daily chart).

However, only after returning to the zone above the resistance level of 2700.0 (EMA200 on the daily chart) it will be possible to speak about the resumption of the bull trend.

The signal for the resumption of sales will be the breakdown of the support level of 2533.0 (EMA200 on the 1-hour chart).

The targets for the decline will be the support levels of 2435.0 (EMA200 on the weekly chart), 2386.0 (Fibonacci 50% of the correction to the growth since February 2016). Fixing below these levels and a further decline will talk about breaking of the bullish trend S&P500.

Support Levels: 2533.0, 2507.0, 2435.0, 2386.0, 2335.0, 2250.0, 2130.0

Resistance Levels: 2584.0, 2603.0, 2615.0, 2676.0, 2700.0


Trading scenarios


Sell Stop 2550.0. Stop Loss 2595.0. Goals 2533.0, 2507.0, 2435.0, 2386.0, 2335.0, 2250.0, 2130.0

Buy Stop 2595.0. Stop Loss 2550.0. Objectives 2603.0, 2615.0, 2676.0, 2700.0


100119-S500-W.png


100119-S500-D.png


100119-S500-H4.png


*) For up-to-date and detailed analytics and news on the forex market visit Tifia Forex Broker website tifia.com
 
AUD/USD: Market Expectations

11/01/2019


US Federal Reserve Chairman Jerome Powell confirmed on Thursday the central bank’s intention to be patient this year in deciding to raise interest rates, taking into account the turbulence observed in recent weeks in financial markets concerned about the problems of global economic growth. “The US economy is strong”, said Powell. “The main source of concern is global growth”. He noted that the economies of the world today are much more interconnected than before, and the question is how much the slowdown in global economic growth will affect the US economy. Powell's optimism and his restraint in raising interest rates the Fed supported stock indexes and commodity currencies, including the Australian dollar.

From the news today we should pay attention to the publication (at 13:30 GMT) of data on consumer inflation in the United States. Inflation data is one of the main, along with data on GDP and the state of the labor market, on which the Fed's monetary policy depends. It is expected that in December, inflation in the United States decreased by -0.1%, but increased by 2.2% in annual terms. If the data turns out to be better than the forecast, then the USD will be strengthened. A decrease in performance will have a negative impact on the dollar.

*)An advanced fundamental analysis is available on the Tifia Forex Broker website at tifia.com/analytics


In general, the long-term bearish trend AUD / USD is still in force. In the long run, short positions are preferable. The reached local maximums probably provide a good opportunity to enter a short position at AUD / USD.

The breakdown of the support level of 0.7150 (ЕМА200 on the 4-hour chart) will cause the resumption of the AUD / USD decline with long-term targets at the support levels of 0.6910 (September 2015 minimum), 0.6830 (2016 lows).

Below the resistance level of 0.7255 (EMA200 on the daily chart) short positions are preferable.

Support Levels: 0.7200, 0.7150, 0.7100, 0.7025

Resistance Levels: 0.7255, 0.7320, 0.7385, 0.7460


Trading Scenarios


Sell in the market. Stop Loss 0.7260. Take-Profit 0.7200, 0.7150, 0.7100, 0.7025, 0.6910, 0.6830

Buy Stop 0.7260. Stop Loss 0.7190. Take-Profit 0.7320, 0.7385, 0.7460

110119-dxy.png


110119-AU-D.png


110119-AU-H4.png


*) For up-to-date and detailed analytics and news on the forex market visit Tifia Forex Broker website tifia.com
 
GBP/USD: Market Expectations

14/01/2018


On Tuesday, a vote will be taken in the British Parliament on a Brexit deal with the EU. As you know, British Prime Minister Theresa May made a Brexit deal with the EU at the end of November, which caused a flurry of criticism from British parliamentarians.

Probably, the parliament will vote against the proposed agreement and the deadline for the British withdrawal from the EU will be postponed from March 29 to a later date. The expected failure of the Brexit vote is, in general, negative news for the pound. However, the effect of this factor on the dynamics of the pound will most likely be short-term, since it has already been taken into account in the quotes.

Below the key resistance level of 1.3035 (ЕМА200 on the daily chart) and due to important fundamental factors, GBP / USD remains under pressure.

In case of breakdown of the support level of 1.2735 (EMA200 on the 4-hour chart) GBP / USD will go into the descending channel on the daily chart and to the support levels of 1.2600 (June 2017 minimums), 1.2485, 1.2365.

The main trend is still bearish. Below the key resistance levels of 1.3215 (Fibonacci level 23.6% of the correction to the decline of the GBP / USD in the wave that started in July 2014 near the 1.7200 level), 1.3035 (ЕМА200 on the daily chart) negative dynamics prevail. Short positions are preferred.

*)An advanced fundamental analysis is available on the Tifia Forex Broker website at tifia.com/analytics


Support Levels: 1.2735, 1.2700, 1.2670, 1.2600, 1.2485, 1.2365, 1.2110, 1.2000

Resistance Levels: 1.2955, 1.3035, 1.3125, 1.3215, 1.3300, 1.3470, 1.3740


Trading Scenarios


Sell Stop 1.2790. Stop Loss 1.2880. Take-Profit 1.2735, 1.2700, 1.2670, 1.2600, 1.2485, 1.2365

Buy Stop 1.2880. Stop Loss 1.2790. Take-Profit 1.2955, 1.3035, 1.3125, 1.3215

140119-GU-D.png


140119-GU-H4.png


*) For up-to-date and detailed analytics and news on the forex market visit Tifia Forex Broker website tifia.com
 
EUR/USD: Trading Scenarios

01/15/2019


A report published on Tuesday showed that Germany’s GDP growth over the past year was 1.5% after a 2.2% increase in 2017. The data suggest a substantial recession risk in the German economy. The minimum annual GDP growth since 2013 has been recorded.

The slowdown in the German economy may cause weakening results for other European countries that supply components for the German automotive industry and other products.

Hard Brexit, the escalation of trade conflicts and factors of political instability in the Eurozone are the main threats to the European economy.

*)An advanced fundamental analysis is available on the Tifia Forex Broker website at tifia.com/analytics


EUR / USD pair declined after published data, closely approaching to the support level of 1.1420 (ЕМА200 on the 4-hour chart, ЕМА50 on the daily chart).

Below the key resistance levels of 1.1525 (EMA144), 1.1575 (EMA200 on the daily chart), the downward trend prevails.

A breakdown of support levels of 1.1420, 1.1400 will return the EUR / USD pair to a long-term bearish trend. Long-term goals of decline are support levels of 1.1285 (Fibonacci level of 23.6% of the correction to a fall from 1.3900 level that began in May 2014), 1.1270 (December lows), 1.1210 (November and year lows), 1.1120 (bottom line of the downward channel on the daily chart, lows of June 2017).

Support Levels: 1.1420, 1.1400, 1.1350, 1.1285, 1.1215, 1.1120

Resistance Levels: 1.1525, 1.1575, 1.1700, 1.1780


Trading recommendations


Sell Stop 1.1390. Stop-Loss 1.1490. Take-Profit 1.1350, 1.1285, 1.1215, 1.1120

Buy Stop 1.1490. Stop-Loss 1.1390. Take-Profit 1.1525, 1.1575, 1.1700, 1.1780


150119-EU-W.png


150119-EU-D.png


*) For up-to-date and detailed analytics and news on the forex market visit Tifia Forex Broker website tifia.com
 
GBP/USD: Current Dynamics

01/16/2019


In December, the annual rate of consumer price inflation in the UK slowed down. According to official data released on Wednesday, the UK consumer price index (CPI) rose by 2.1% in December compared with the same period last year, after rising 2.3% in November. The retail price index (RPI) +0.4% m/m, +2.7% y/y (the forecast was +0.5% m/m, +2.9% y/y), the producer selling prices index (Output PPI) -0.3% m/m, +2.5% y/y (the forecast was 0% m/m and +2.9% y/y). The data can be called ambiguous. On the one hand, they point to an increase in inflation, while inflation remains above the target level of the Bank of England at 2%. But, on the other hand, the data indicate a slowdown in inflation.

The publication of the data remained almost unnoticed, as all market attention focused on Brexit. The proposed by Prime Minister Theresa May, the plan of the deal was rejected on Tuesday by parliament. The vote in the British Parliament on the confidence of Theresa May will begin at 19:00 (GMT). With the opening of the trading day, GBP/USD is moderately decreasing, trading in the middle of the European session near the level of 1.2850.

Probably, Theresa May will be able to defend their post. However, the uncertainty of the future relationship between the EU and the UK is a negative factor for the pound. "Hard" Brexit without a trade agreement with the EU countries will deal a severe blow to the UK economy.

*)An advanced fundamental analysis is available on the Tifia Forex Broker website at tifia.com/analytics


Support and resistance levels

The pound remains under pressure due to the domestic political crisis in the UK and Brexit.

The main trend of GBP/USD is still bearish. Below the key resistance levels of 1.3210 (Fibonacci level 23.6% of the correction to the decline of the GBP/USD in the wave that started in July 2014 near the level of 1.7200), 1.3030 (ЕМА200 on the daily chart) negative dynamics prevail. Short positions are preferred.

Support Levels: 1.2750, 1.2700, 1.2670, 1.2600, 1.2485, 1.2365, 1.2110, 1.2000

Resistance Levels: 1.2950, 1.3030, 1.3125, 1.3210, 1.3300, 1.3470, 1.3740


Trading scenarios


Sell Stop 1.2820. Stop Loss 1.2920. Take-Profit 1.2750, 1.2700, 1.2670, 1.2600, 1.2485, 1.2365

Buy Stop 1.2920. Stop Loss 1.2820. Take-Profit 1.2950, 1.3030, 1.3125, 1.3210

160119-GU-D.png


160119-GU-H4.png


*) For up-to-date and detailed analytics and news on the forex market visit Tifia Forex Broker website tifia.com
 
EUR/USD: good reasons are needed for the Eurodollar growth

01/17/2019

Current situation


The updated data, published on Thursday, confirmed the forecasts of economists that in December annual inflation in the Eurozone amounted to 1.6% against 1.9% in November. In conjunction with the recently published weak data, inflation indicators indicate a decrease in the likelihood that the ECB will be able to increase the rate in 2019.

Against the background of the situation with Brexit, the ECB is likely to take a waiting position at the next meeting to be held next week. January 24 will be published by the ECB decision on rates. Probably, the ECB will also express concern about the worsening growth prospects of the economy.

On Tuesday, ECB President Mario Draghi said that the European economy still needs substantial stimulation. Investors considered this a signal for a possible extension of the QE program.

At the same time, the Beige Book, published Wednesday, drew a positive picture for the US economy. “Overall, the outlook remains positive”, the report says.

Thus, according to economists, the prospects for a substantial strengthening of the euro and the growth of EUR / USD look inconclusive. Probably further weakening of the Eurodollar. For the growth of the pair EUR / USD we need good reasons and a significant weakening of the dollar.

*)An advanced fundamental analysis is available on the Tifia Forex Broker website at tifia.com/analytics


Support and resistance levels

Despite the corrective growth of EUR / USD, which began in mid-November, negative dynamics prevail below the resistance level of 1.1570 (ЕМА200 on the daily chart).

In case of resumption of reduction, the nearest targets will be the support levels of 1.1350, 1.1285 (Fibonacci level 23.6% of the correction to the fall from 1.3900 level, which began in May 2014), 1.1270 (December lows), 1.1215 (November and year lows).

An alternative scenario involves the breakdown of the short-term resistance level of 1.1440 (ЕМА200 on the 1-hour chart) and the resumption of corrective growth. However, the growth of EUR / USD will be limited by the resistance level of 1.1570.

Support Levels: 1.1350, 1.1285, 1.1215

Resistance Levels: 1.1400, 1.1417, 1.1440, 1.1520, 1.1570, 1.1680, 1.1780


Trading recommendations


Sell in the market. Stop-Loss 1.1450. Take-Profit 1.1350, 1.1285, 1.1215

Buy Stop 1.1450. Stop-Loss 1.1390. Take-Profit 1.1520, 1.1570, 1.1700, 1.1780

170119-dxy.png


170119-EU-D.png


170119-EU-H4.png


*) For up-to-date and detailed analytics and news on the forex market visit Tifia Forex Broker website tifia.com
 
GBP/USD: Market Expectations

01/18/2019


The pound is falling on Friday after strong growth on the eve amid rumors about a possible postponement of the UK exit from the EU, as well as the possibility of a second Brexit referendum.

The past week’s vote in the British Parliament on the Brexit deal with the EU failed for British Prime Minister Theresa May, and now she will have to submit a new plan on Monday. Most likely, it will differ little from the previous plan.

Brexit uncertainty is getting stronger, putting pressure on the pound. According to the National Bureau of Statistics (ONS), presented on Friday, retail sales in the UK decreased by 0.9% in December compared with the previous month. This report was another signal that the growth momentum of the UK economy faded in the last three months of 2018. According to economists, more stringent credit conditions, as well as the uncertainty of future UK relations with the EU have a negative impact on consumer confidence.

Meanwhile, the dollar remains stable and attractive, despite the domestic political crisis in the United States. Investors are worried about slowing global economic growth, trade conflicts, market volatility, partial suspension of government agencies and weak production data, and Fed officials said they would continue to be patient with rising interest rates.

On Friday, between 14:15 and 15:00 (GMT), important macro data from the United States will be published, including industrial production data for December and consumer confidence for January. Overall, the data is expected to be strong, despite a relative decline of values. The data should support the dollar, which is still in demand against the background of domestic political problems in Europe, as well as a slowdown in the growth of the Chinese economy due to the trade conflict between the US and China.

*)An advanced fundamental analysis is available on the Tifia Forex Broker website at tifia.com/analytics


On Friday, GBP / USD is falling, bargaining at the beginning of the European session near the level of 1.2940, below the resistance levels of 1.3030 (EMA200), 1.2950 (EMA144 on the daily chart). A break of the short-term support level of 1.2770 (EMA200 on the 4-hour chart) will confirm the scenario for the resumption of the bearish trend and direct GBP / USD to the support levels of 1.2600 (June 2017 lows), 1.2485, 1.2365.

The main trend is still bearish. Below the key resistance levels of 1.3210 (Fibonacci level 23.6% of the correction to the decline of the GBP / USD pair in the wave that started in July 2014 near the level of 1.7200), 1.3030 (ЕМА200 on the daily chart) negative dynamics prevail.

Support Levels: 1.2770, 1.2700, 1.2670, 1.2600, 1.2485, 1.2365, 1.2110, 1.2000

Resistance Levels: 1.2950, 1.3030, 1.3125, 1.3210, 1.3300, 1.3470, 1.3740


Trading scenarios


Sell in the market. Stop Loss 1.3010. Take-Profit 1.2770, 1.2700, 1.2670, 1.2600, 1.2485, 1.2365

Buy Stop 1.3010. Stop Loss 1.2920. Take-Profit 1.3030, 1.3125, 1.3210

180119-dxy.png


180119-GBP-D.png


180119-GBP-H4.png


*) For up-to-date and detailed analytics and news on the forex market visit Tifia Forex Broker website tifia.com
 
EUR/USD: support and resistance levels

01/21/2019


Since mid-November, EUR / USD has been rising in the upward channel on the daily chart, the upper limit of which is above the key resistance level of 1.1565 (ЕМА200 on the daily chart). Last week, from the level of 1.1565 there was a rebound, and the pair could not develop an upward trend. EUR / USD declines again, trading on Monday below the important short-term resistance level of 1.1415 (EMA200 on the 4-hour chart, EMA50 on the daily chart).

The immediate targets for the decline in case of breakdown of the local support level of 1.1350 will be the support levels of 1.1300, 1.1285 (Fibonacci 23.6% of the correction to the fall from 1.3900, which began in May 2014), 1.1270 (December lows), 1.1215 (November and year lows) .

Breakdown of the short-term resistance level of 1.1415 will be a signal for the realization of the scenario for the resumption of growth of EUR / USD. However, below the resistance level of 1.1565 negative dynamics prevail. Short positions are preferred.

On Thursday, the next ECB meeting will be held on monetary policy issues. Most likely, the ECB will keep current key interest rates at the same level. The basic interest rate will remain at the same level of 0%; the ECB deposit rate for commercial banks is also likely to remain unchanged at -0.4%.

As the ECB head Mario Draghi said last week, the recent economic indicators were worse than expected, and the European economy still needs substantial stimulation. If Mario Draghi reiterates this possibility in the coming months, the euro will decline.

*)An advanced fundamental analysis is available on the Tifia Forex Broker website at tifia.com/analytics


Support Levels: 1.1350, 1.1300, 1.1285, 1.1215

Resistance Levels: 1.1400, 1.1415, 1.1515, 1.1565, 1.1680, 1.1780


Trading Scenarios


Sell in the market. Stop-Loss 1.1420. Take-Profit 1.1350, 1.1285, 1.1215

Buy Stop 1.1420. Stop-Loss 1.1340. Take-Profit 1.1500, 1.1515, 1.1565

210119-dxy.png


210119-EU-D.png


210119-EU-H4.png


*) For up-to-date and detailed analytics and news on the forex market visit Tifia Forex Broker website tifia.com
 
Back
Top