SOLID ECN LLC
Solid ECN Representative
- Messages
- 511

The New Zealand dollar shows active growth against the US dollar during the Asian session, quickly recovering from the decline the day before, which proceeded against the backdrop of a sharp strengthening of the US currency. The US dollar was supported yesterday by the "hawkish" rhetoric of the Chairman of the US Federal Reserve, Jerome Powell, who reiterated the regulator's readiness to do everything necessary to curb inflation, which, in his opinion, threatens the foundations of the US economy.
Meanwhile, macroeconomic statistics from the US again turned out to be negative. Building Permits Change in April fell by 3.2% after rising by 1.2% a month earlier. Analysts had expected positive dynamics to remain at 1.0%. Housing Starts in April decreased from 1.728 million to 1.724 million. The MBA Mortgage Applications fell 11% as of May 13 after rising 2% in the previous period.
Today's data from New Zealand do not have a significant impact on the dynamics of the instrument. Anyway, the Producer Price Index Input in Q1 2022 increased by 3.6% after rising by 1.1% in the previous quarter. The Producer Price Index Output for the same period accelerated from 1.4% to 2.6%.
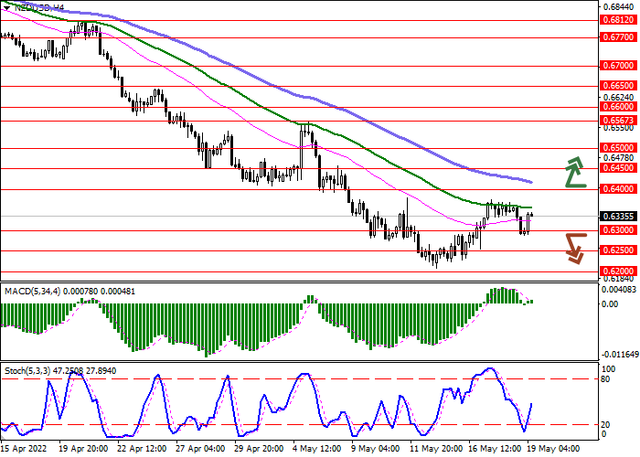
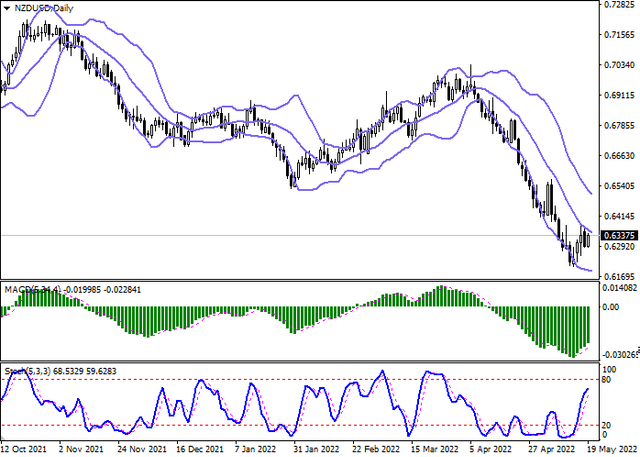
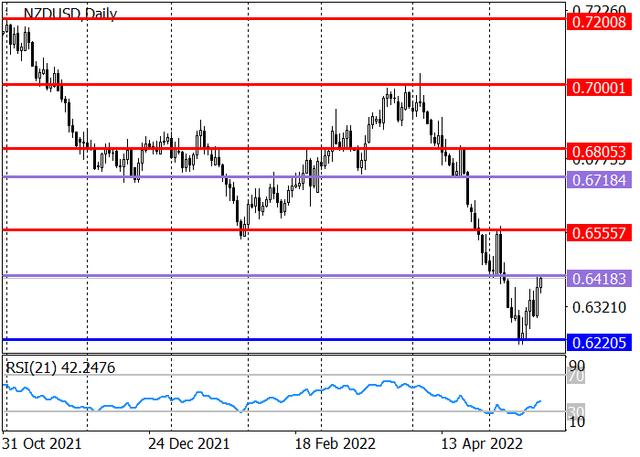
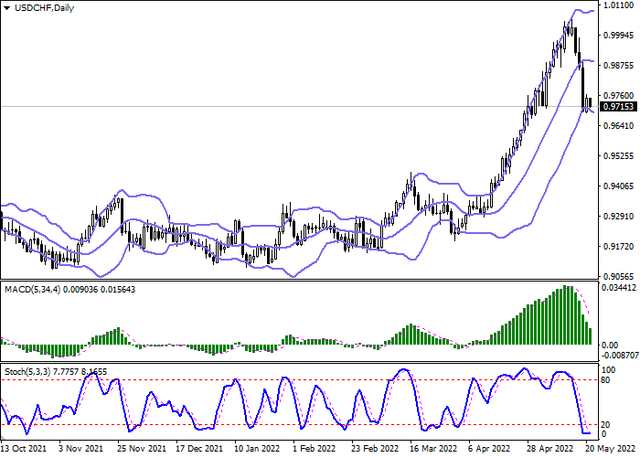
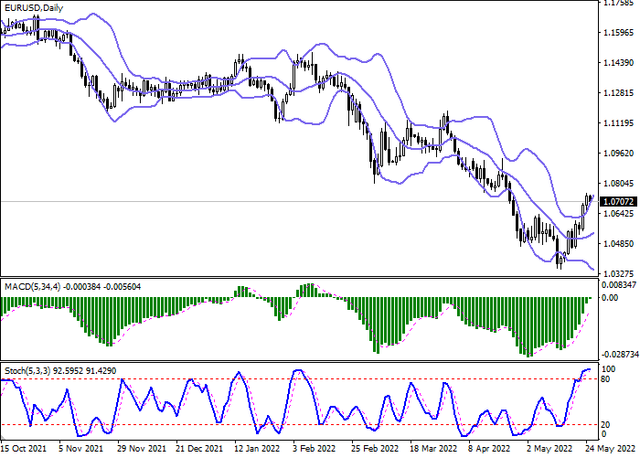
In the D1 chart, Bollinger Bands are reversing horizontally. The price range is narrowing, reflecting the emergence of ambiguous dynamics of trading in the short term. MACD grows, preserving a stable buy signal (located above the signal line). Stochastic keeps its upward direction but is rapidly approaching its highs, which reflects the risks of overbought NZD in the ultra-short term.
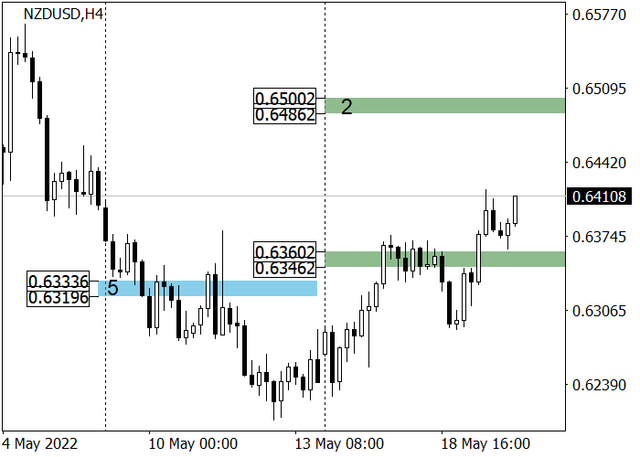
Resistance levels: 0.6400, 0.6450, 0.6500, 0.6567 | Support levels: 0.6300, 0.6250, 0.6200, 0.6150