Only Elliot Wave Analysis - SolidECN

USDCHF - A fall is possible.

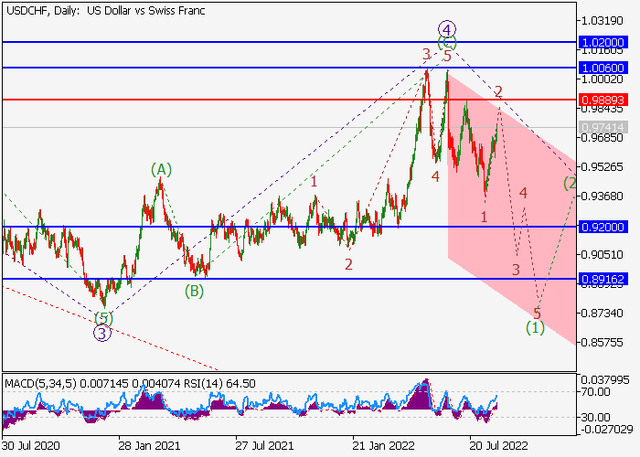
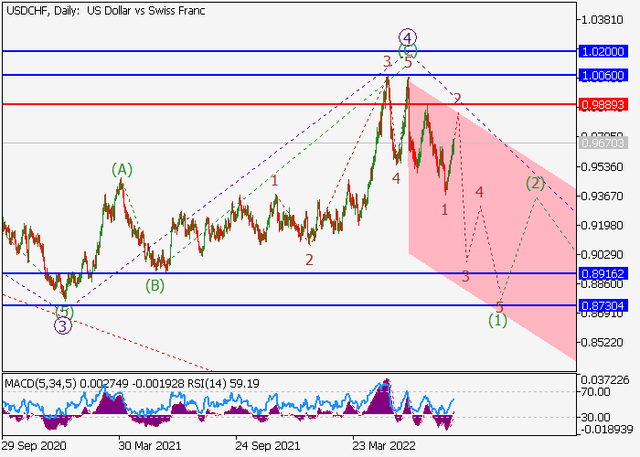
On the daily chart, the downward fifth wave of the higher level 5 develops, within which the first wave (1) of 5 forms. Now, the first wave of the lower level 1 of (1) has formed and a local correction is developing as the second wave 2 of (1).

If the assumption is correct, after the end of the correction, the USDCHF pair will fall to the area of 0.8916 – 0.8730. In this scenario, critical stop loss level is 0.9889.

usdchf.png
 
Crude Oil - Growth is possible

On the daily chart, the upward wave C forms, within which the first wave 1 of (1) of C developed and a downward correction ended as the second wave 2 of (1) of C. Now, the third wave 3 of (1) has started, within which the first entry wave of the lower level (i) of i of 3 is developing.

If the assumption is correct, Brent Crude Oil will grow to the area of 127.04 – 139.4. In this scenario, critical stop loss level is 92.72.

oil.png
 
Silver - Growth is possible.

On the daily chart, a downward correction of the higher level developed as the second wave (2), within which the wave C of (2) formed, and the third wave (3) started. Now, the first entry wave of the lower level i of 1 of (3) is developing, within which the wave (i) of i has formed, and a local correction has ended as the wave (ii) of i.

If the assumption is correct, the XAGUSD pair will grow to the area of 22.47 – 25.4. In this scenario, critical stop loss level is 18.05.

silver.png
 
EURUSD - A fall is possible

On the daily chart, the downward wave of the higher level C of (B) develops, within which the fifth wave v of (C) forms. Now, the fifth wave of the lower level v of C is forming, within which the wave (v) of v of C is developing.

If the assumption is correct, the EURUSD pair will fall to the area of 0.98 – 0.97. In this scenario, critical stop loss level is 1.008.

eurusd.png
 
USDCAD - A fall is possible.

On the weekly chart, the downward correctional wave of the higher level 4 develops, within which the wave (C) of 4 forms. Now, the third wave 3 of (C) is developing, within which the first entry wave of the lower level (i) of i of 3 has formed, and a local correction has ended as the wave (ii) of i of 3.

If the assumption is correct, the USDCAD pair will fall to the area of 1.2374 – 1.201. In this scenario, critical stop loss level is 1.3224.

usdcad.png
 
USDCHF - A fall is possible.

On the daily chart, the fifth downward wave of the higher level 5 develops, within which the first wave (1) of 5 forms. Now, the first wave of the lower level 1 of (1) has formed, and a local correction is ending as the second wave 2 of (1), within which the wave c of 2 is forming.

If the assumption is correct, after the end of the correction, the USDCHF pair will fall to the area of 0.92 – 0.8916. In this scenario, critical stop loss level is 0.9889.

usdchf.png
 
AUDUSD - A fall is possible.

On the daily chart, the first wave of the higher level (1) of C ended, and a downward correction forms as the wave (2) of C, within which the wave C of (2) develops. Now, the third wave of the lower level iii of C has formed, a correction has formed as the fourth wave iv of C, and the fifth wave v of C is developing, within which the local correction (ii) of v has developed and the wave (iii) of v is developing.

If the assumption is correct, the AUDUSD pair will fall to the area of 0.66 – 0.645. In this scenario, critical stop loss level is 0.701.

audusd.png
 

EURUSD - A fall is possible.​

On the daily chart, the downward wave of the higher level C of (B) develops, within which the fifth wave v of (C) forms. Now, the fifth wave of the lower level v of C is developing, within which the wave (v) of v of C is forming.

If the assumption is correct, the EURUSD pair will fall to the area of 0.98 – 0.97. In this scenario, critical stop loss level is 1.0082.

eurusd.png
 
GBPUSD - A fall is possible.

On the daily chart, the fifth wave of the higher level V develops, within which the wave (1) of V forms. Now, the fifth wave of the lower level 5 of (1) is developing, within which the wave iii of 5 is forming.

If the assumption is correct, the GBPUSD pair will fall to the area of 1.13 – 1.105. In this scenario, critical stop loss level is 1.1887.

gbpusd.png
 
USDJPY - Growth is possible.

On the daily chart, the third wave of the higher level 3 develops, within which the third wave of the lower level iii of 3 formed and a downward correction ended as the fourth wave iv of 3. Now, the fifth wave v of 3 is forming, within which the first wave of the lower level (i) of v has developed.

If the assumption is correct, after the end of the local correction (ii) of v the USDJPY pair will grow to the area of 145 – 150. In this scenario, critical stop loss level is 135.

usdjpy.png
 
Back
Top