Only Elliot Wave Analysis - SolidECN

USDCAD - A fall is possible.

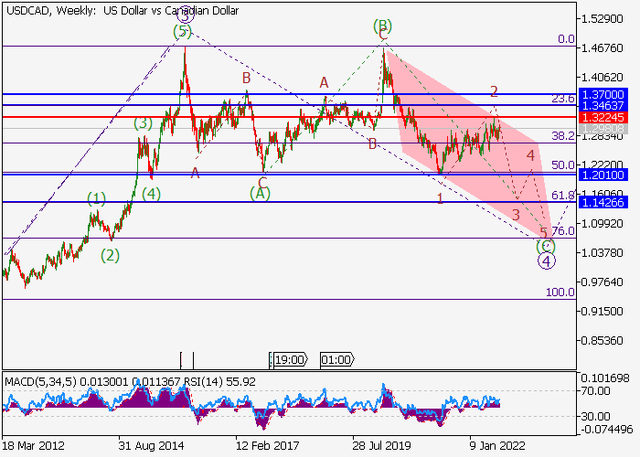
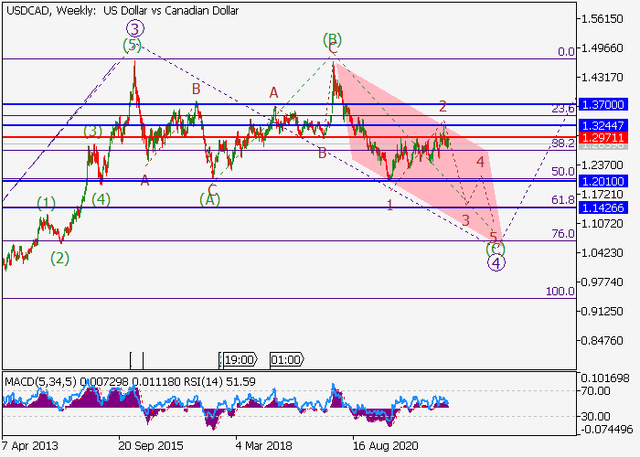
On the weekly chart the correctional downward wave of the higher level 4 develops, within which the wave (C) of 4 forms. Now, the first wave of the lower level 1 of (C) has formed, a local correction has ended as the second wave 2 of (C), and the third wave 3 of (C) is forming, within which the wave i of 3 is developing.

If the assumption is correct, the USDCAD pair will fall to the area of 1.2010 – 1.1426. In this scenario, critical stop loss level is 1.2971.

usdcad.png
 
USDCHF - A fall is possible.

On the daily chart, the downward fifth wave of the higher level 5 develops, within which the first wave (1) of 5 forms. Now, the third wave of the lower level 3 of (1) is developing, within which the wave iii of 3 is forming.

If the assumption is correct, the USDCHF pair will fall to the area of 0.8916 – 0.8730. In this scenario, critical stop loss level is 0.9647.

usdchf.png
 
AUDUSD - A fall is possible.

On the daily chart, the first wave of the higher level (1) of C ended and a downward correction develops as the wave (2) of C, within which the wave C of (2) develops. Now, the third wave of the lower level iii of C has formed, a local correction has formed as the fourth wave iv of C and the fifth wave v of C is forming.

If the assumption is correct, the AUDUSD pair will fall to the area of 0.66 – 0.645. In this scenario, critical stop loss level is 0.7134.

audusd.png
 
NZDUSD - Growth is possible.

On the daily chart, the upward wave of the higher level (А) of B formed and a downward correction ended as the wave (B) of B. Now, the wave (C) of B has started, within which the first wave of the lower level i of 1 of (C) has appeared and a local correction is developing as the wave ii of 1 of (C).

If the assumption is correct, after the end of the correction, the NZDUSD pair will grow to the area of 0.6815 – 0.705. In this scenario, critical stop loss level is 0.6066.

nzdusd.png
 
USDJPY - A fall is possible.

On the daily chart, the third wave of the higher level 3 develops, within which the third wave of the lower level iii of 3 formed. Now, a downward correction is forming as the fourth wave iv of 3, within which the wave (a) of iv has developed, and the wave (b) of iv is ending.

If the assumption is correct, after the end of the correction, the USD/JPY pair will fall to the area of 127.06–123.50. In this scenario, critical stop loss level is 137.30.

usdjpy.png
 
AUDUSD - A fall is possible.

On the daily chart, the first wave of the higher level (1) of C ended and a downward correction develops as the wave (2) of C, within which the wave C of (2) forms. Now, the third wave of the lower level iii of C has formed, a correction has formed as the fourth wave iv of C and the fifth wave v of C is developing, within which the local correction (ii) of v is developing.

If the assumption is correct, after the end of the correction, the AUDUSD pair will fall to the area of 0.66 – 0.645. In this scenario, critical stop loss level is 0.7134.

audusd.png
 
IBM - Growth is possible.

On the daily chart, the first wave of the higher level (1) develops, within which the fifth wave 5 of (1) forms. Now, the third wave of the lower level iii of 5 is developing, within which the wave (i) of iii has developed, a local correction has ended as the wave (ii) of iii and the wave (iii) of iii is developing.

If the assumption is correct, the asset will grow to the area of 153.45 – 160. In this scenario, critical stop loss level is 125.1.

ibm.png
 
NZDUSD - Growth is possible.

On the daily chart, the upward wave of the higher level (А) of B formed and a downward correction ended as the wave (B) of B. Now, the wave (C) of B has started, within which the first wave of the lower level i of 1 of (C) has formed and a local correction has developed as the wave ii of 1 of (C).

If the assumption is correct, the NZDUSD pair will grow to the area of 0.6576 – 0.6815. In this scenario, critical stop loss level is 0.6066.

nzdusd.png
 
USDCAD - A fall is possible.

On the weekly chart, the downward correctional wave of the higher level 4 develops, within which the wave (C) of 4 forms. Now, = the third wave 3 of (C) is developing, within which the first entry wave of the lower level (i) of i of 3 has formed, and a local correction is ending as the wave (ii) of i of 3.

If the assumption is correct, after the end of the correction, the USDCAD pair will fall to the area of 1.201 – 1.1426. In this scenario, critical stop loss level is 1.3224.

usdcad.png
 
Back
Top