Only Elliot Wave Analysis - SolidECN

USDCHF - Growth is possible.​

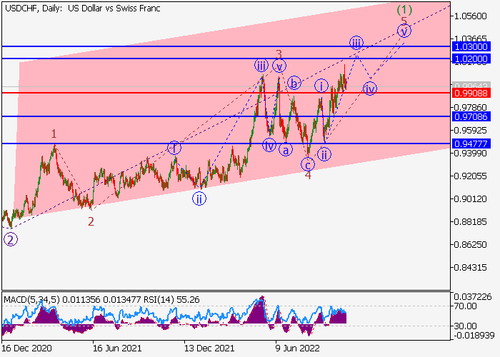
On the daily chart, the first upward wave of the higher level (1) of 3 develops, within which the wave 5 of (1) forms. Now, the third wave of the lower level iii of 5 is developing, within which a local correction is developing as the wave (iv) of iii.

If the assumption is correct, the USDCHF pair will grow to the area of 1.02 – 1.03. In this scenario, critical stop loss level is 0.9908.

DUggDB.md.png
 

AUDUSD - The pair is in a correction, a fall is possible.​

On the daily chart, the first wave of the higher level (1) developed, and a downward correction forms as the second wave (2), within which the wave C of (2) forms. Now, the third wave of the lower level iii of C is forming, the wave (iii) of iii has formed, and a local correction is ending as the wave (iv) of iii.

If the assumption is correct, the AUDUSD pair will fall to the area of 0.6091 – 0.59. In this scenario, critical stop loss level is 0.6682.

audusd.png
 
NZDUSD - The pair may grow.

On the daily chart, the upward wave of the higher level (А) formed, and a downward correction ended as the wave (B), within which the wave C of (B) formed. Now, the development of the wave (C) has started, and the entry first wave of the lower level i of 1 of (C) has formed.

If the assumption is correct, the NZDUSD pair will grow to the area of 0.6166 – 0.6465. In this scenario, critical stop loss level is 0.5520.

nzdusd.png
 

USDJPY - The pair is in a correction; a fall is possible.​

On the daily chart, the third wave of the higher level 3 developed, within which the fifth wave of the lower level v of 3 formed. Now, a downward correction has started as the fourth wave 4, within which the wave of the lower level a of 4 is developing.

If the assumption is correct, the USDJPY pair will fall to the area of 140.13–136.82. In this scenario, critical stop loss level is 151.76.

usdjpy.png
 

XAUUSD - Growth is possible.​

On the daily chart, a downward correction ended as the fourth wave of the higher level (4), within which the wave C of (4) formed as a momentum. Now, the development of the fifth wave (5) has started, within which the first entry wave of the lower level (i) of i of 1 of (5) has formed, a local correction has ended as the wave (ii) of i of 1 of (5), and the wave (iii) of i of 1 of (5) is developing.

If the assumption is correct, the XAUUSD pair will grow to the area of 1808.78–1861.3. In this scenario, critical stop loss level is 1616.73.

gold-elliot.png
 

USDJPY - The pair is in a correction; a fall is possible.​

On the daily chart, the third wave of the higher level 3 ended, and a downward correction started as the fourth wave 4. Now, the wave of the lower level a of 4 is developing, within which a local correction is ending as the wave (iv) of a.

If the assumption is correct, the USDJPY pair will fall to the area of 140.13 – 136.82. In this scenario, critical stop loss level is 151.76.

usdjpy.png
 
Silver - Growth is possible.

On the daily chart, a downward correction of the higher level ended as the second wave (2), within which the wave C of (2) formed, and the development of the third wave (3) started. Now, the first entry wave of the lower level i of 1 of (3) is forming, within which the wave (iii) of I has formed, a local correction has ended as the wave (iv) of i, and the wave (v) of I is developing.

If the assumption is correct, the XAGUSD pair will grow to the area of 21.2 – 22.47. In this scenario, critical stop loss level is 18.22.

silver.png
 
PayPal - Growth is possible.

On the daily chart, the upward wave of the higher level А formed, and a downward correction develops as the wave B. Now, the wave (А) of B has formed, and an upward correction of the lower level is developing as the wave (B) of B, within which the wave A of (B) has ended, and the wave B of (B) is ending.

If the assumption is correct, the asset will grow within the wave C of (B) to the area of 158.6 – 186.7. In this scenario, critical stop loss level is 67.4.

paypal.png
 

Bank of America - The price is in a correction, a fall is possible.​

On the daily chart, the first wave of the higher level 1 formed, and a downward correction develops as the second wave 2, within which the wave (А) of 2 formed, and a local correction is ending to develop as the wave (B) of 2. Now, the wave C of (B) is developing.

If the assumption is correct, the price will fall to the area of 26.32 – 20.82. In this scenario, critical stop loss level is 42.27.

bac.png
 
AUDUSD - A fall is possible.

On the daily chart, the first wave of the higher level (1) ended, and a downward correction forms as the second wave (2), within which the wave C of (2) develops. Now, the third wave of the lower level iii of C is developing, the wave (iii) of iii has formed, and a local correction has ended as the wave (iv) of iii.

If the assumption is correct, the AUDUSD pair will fall within the wave (v) of iii to the area of 0.6091–0.59. In this scenario, critical stop loss level is 0.6540.

audusd.png
 
Back
Top