SOLID ECN LLC
Solid ECN Representative
- Messages
- 514
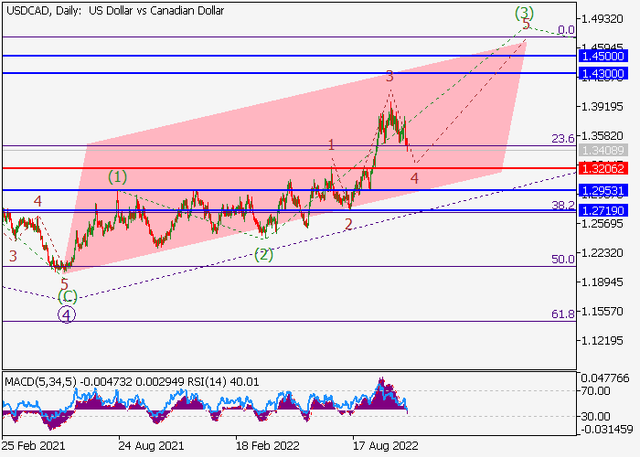
USDCAD - The price is in a correction and may grow.
On the daily chart, the upward fifth wave of the higher level 5 develops, within which the wave (1) of 5 formed, the correctional wave (2) of 5 ended, and the wave (3) of 5 develops. Now, the third wave of the lower level 3 of (3) has formed, and a local correction is developing as the fourth wave 4 of (3).
If the assumption is correct, the USDCAD pair will grow to the area of 1.43 – 1.45. In this scenario, critical stop loss level is 1.3346.
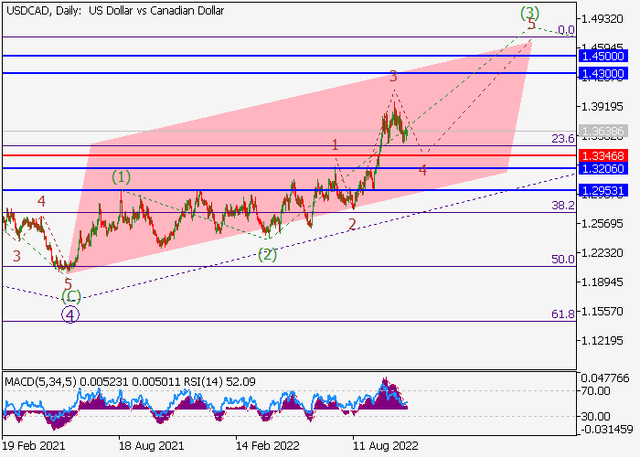