SOLID ECN LLC
Solid ECN Representative
- Messages
- 515
Silver Technical analysis
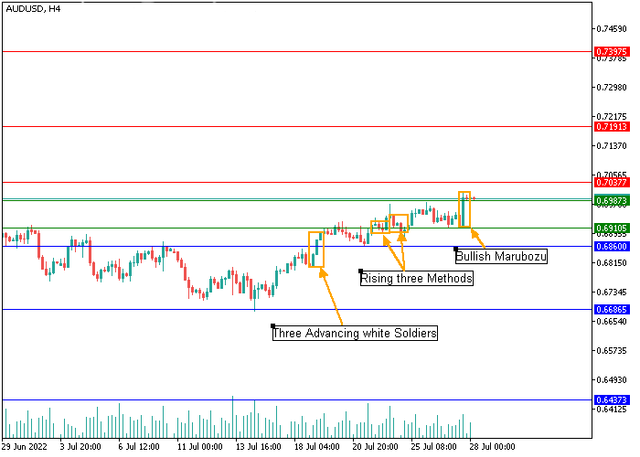
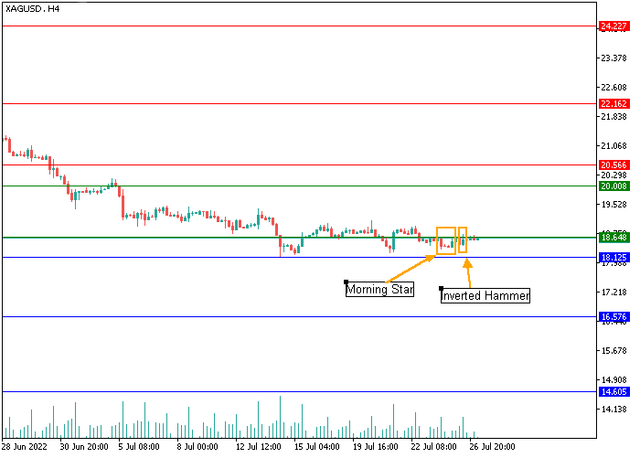
H4
On the four-hour chart, there is a long-term consolidation of the asset in the range of 18.12–20, and at the moment, above 18.12, the quotes have formed a Morning star candlestick analysis model, which is a reversal formation at the bottom. Also, an Inverted hammer pattern has formed, the green color of which emphasizes the "bullish" strength. The combination of these figures indicates that the trading instrument has reached the bottom and a high probability of further recovery to the resistance level of 20.56, the breakout of which will increase the upward dynamics to the zone of 22.16−24.22. An alternative scenario is possible if the "bulls" fail to hold the key level of 18.12. The instrument may drop to the range of 16.57–14.6.
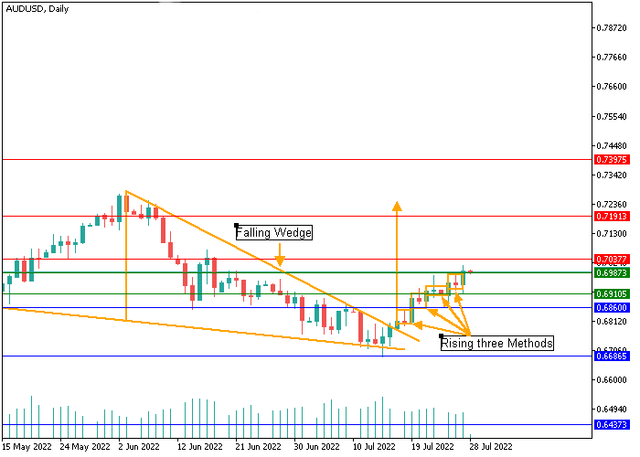
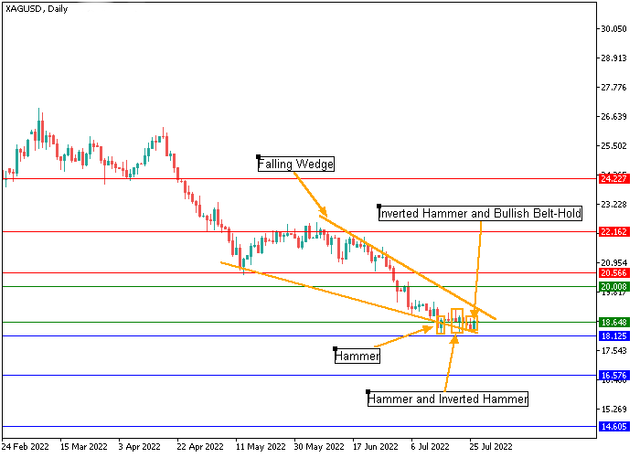
D1
On the daily chart, the falling Wedge price pattern is being completed. The fact that the asset has reached the bottom is also indicated by the appearance above the support level of 18.12 of a series of Hammer and Inverted hammer figures. Also, the confirmation of the increasing activity of buyers can serve as a model of a "bullish" Belt hold. In this situation, the probable scenario of the price movement seems to be the breakout of the upper border of the Wedge with further growth to the area of 20.56−24.22.
Support levels: 18.12, 16.57, 14.6 | Resistance levels: 20.56, 22.16, 24.22
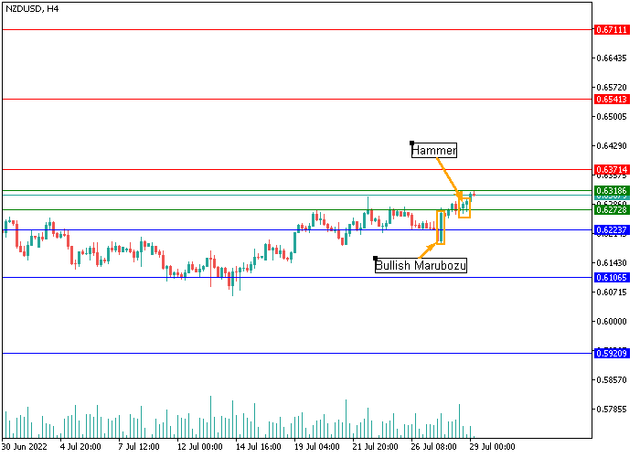
H4
On the four-hour chart, there is a long-term consolidation of the asset in the range of 18.12–20, and at the moment, above 18.12, the quotes have formed a Morning star candlestick analysis model, which is a reversal formation at the bottom. Also, an Inverted hammer pattern has formed, the green color of which emphasizes the "bullish" strength. The combination of these figures indicates that the trading instrument has reached the bottom and a high probability of further recovery to the resistance level of 20.56, the breakout of which will increase the upward dynamics to the zone of 22.16−24.22. An alternative scenario is possible if the "bulls" fail to hold the key level of 18.12. The instrument may drop to the range of 16.57–14.6.
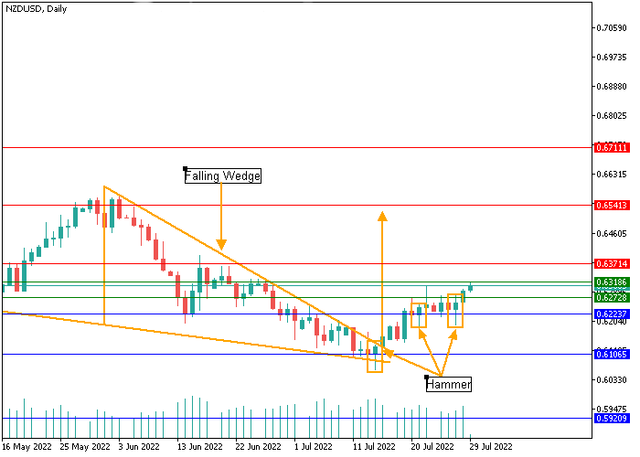
D1
On the daily chart, the falling Wedge price pattern is being completed. The fact that the asset has reached the bottom is also indicated by the appearance above the support level of 18.12 of a series of Hammer and Inverted hammer figures. Also, the confirmation of the increasing activity of buyers can serve as a model of a "bullish" Belt hold. In this situation, the probable scenario of the price movement seems to be the breakout of the upper border of the Wedge with further growth to the area of 20.56−24.22.
Support levels: 18.12, 16.57, 14.6 | Resistance levels: 20.56, 22.16, 24.22