Part VI. Trading moving averages crossover

Commander in Pips: Once in this chapter we said that traders very often use not one, but two different MAs to clearly understand what trend is currently on the market. Also two MAs are more effectively safe trader from unwelcome trading due fake outs. Can you remind me how it could be done by using different MAs?
Pipruit: Yes, Sir. I remember that. First, we should plot two MAs with different periods. One MA should have a longer period, while the second MA – a shorter period. For instance, they could be 15-period and 5-period. Once we’ve done this – then we treat the trend as bullish if the shorter term MA is above the longer term, and as a bearish when it’s vice versa – the short term MA is below long term. Also the application of two different MAs allows us to eliminate fake outs. If during some unwelcome splash on the market that could, by the way, penetrate short term MA, or even the long term one too, MAs themselves hold their position so, that the trend remains intact – then we can ignore this fake out and hold our trade.

Commander in Pips: Absolutely, and what do you mean under “If… MAs themselves hold their position so, that the trend remains intact…”?
Pipruit: It means that despite the splash of prices short term MA continue to stand above/below longer term MA and does not penetrate it.
Commander in Pips: Good. But you should know not only how to use MAs for determining the trend, but also how to use them to get some clue that trend possibly is near to its end.
Pipruit: Sounds interesting.
Commander in Pips: And today we will talk about this – using a crossover of MAs as a trading strategy. In general, this strategy includes the following points:
1. Plot two different by period value MAs on the chart. One MA should have a shorter period value than the other. Periods to choose depend from your own trading style, particular pair, time frame and your own analysis of the suitability of the particular types of MAs and their periods;
2. When the MAs cross over each other – it could be a signal of trend shifting. Specifically:
- If the short term MA crosses the long term one from below it and exits above it – the trend turns bullish;
- If the short term MA crosses the long term one from above it and exits below it – the trend turns bearish.
Here is how it looks on a chart:
Chart #1 shows an application of this method on an AUD/USD weekly chart. The blue line is a 7 period SMA and the green line is a 15 period SMA. If you have applied this crossing strategy on this chart, their initial cross put you in flawless down trend and you were absolutely happy with that. Always you are happy at any points, where I post on the chart “Buy” or “Sell”, because there is an excellent trend that is followed after these points. Also, take a note, how this combination of two different MAs keeps multiple fake outs without the trend shifting. Amazing!
But, as we already know – there is nothing perfect on market, otherwise everybody makes money all the time. Here is the fly in the ointment – periods of market consolidations can lead to losses. Because your trades fall into the whipsaw price action (grey rectangles). See – you have to follow strategy rules strictly, so you have to buy and sell, and buy again. Although losses are not so crucial – still these trades are not profitable either. On chart #1 we have a mostly trending market with short periods of consolidation and whipsaw losses. But you can’t know it ahead of time! What if market will be mostly a ranging market, rather than trending market?
As usual, before jumping aboard, you should estimate where you will place your stop loss order and apply strict rules of money management that allow you to stay in trading despite consecutive losses.
Commander in Pips: Absolutely. As you understand this strategy theoretically assumes that you have a position every time. When MAs cross each other, you just shift position to the opposite, but not totally close the previously opened one. You can apply stop loss orders additionally to each position. Let’s make some conclusion about this strategy:
1. This strategy will give you excellent results on a volatile and trending market, where periods of consolidation are not so long-term. Like on our chart;
2. If market is ranging during most of the trading time – more probable it is that this strategy will give you much shallower results, or even a net loss;
3. This tells us, that you can catch a lot of painful crossovers before you really will be able to ride the trend.
4. This strategy demands many tools such as – applying of stop loss, additional filters for entering into trades, some signal confirmations and other tools, that allow you to reduce losses and filter out whipsaw action, at least partially. Also this strategy demands preliminary investigation of different pairs to choose historically the most trending from them, and optimization of the MAs periods that will work best.
Commander in Pips: And today we will talk about this – using a crossover of MAs as a trading strategy. In general, this strategy includes the following points:
1. Plot two different by period value MAs on the chart. One MA should have a shorter period value than the other. Periods to choose depend from your own trading style, particular pair, time frame and your own analysis of the suitability of the particular types of MAs and their periods;
2. When the MAs cross over each other – it could be a signal of trend shifting. Specifically:
- If the short term MA crosses the long term one from below it and exits above it – the trend turns bullish;
- If the short term MA crosses the long term one from above it and exits below it – the trend turns bearish.
Here is how it looks on a chart:
Chart #1 AUD/USD Weekly - 7 SMA (blue) and 15 SMA (green)
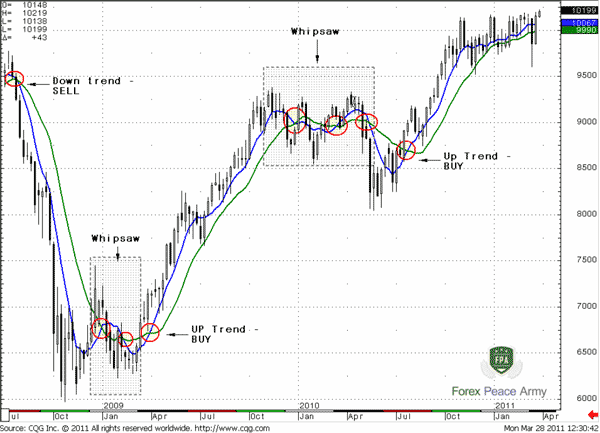
So, crossing of MAs could tell you, that possibly the trend is close to an end. This could let you to open a position in the direction of the new trend at a better price.Chart #1 shows an application of this method on an AUD/USD weekly chart. The blue line is a 7 period SMA and the green line is a 15 period SMA. If you have applied this crossing strategy on this chart, their initial cross put you in flawless down trend and you were absolutely happy with that. Always you are happy at any points, where I post on the chart “Buy” or “Sell”, because there is an excellent trend that is followed after these points. Also, take a note, how this combination of two different MAs keeps multiple fake outs without the trend shifting. Amazing!
But, as we already know – there is nothing perfect on market, otherwise everybody makes money all the time. Here is the fly in the ointment – periods of market consolidations can lead to losses. Because your trades fall into the whipsaw price action (grey rectangles). See – you have to follow strategy rules strictly, so you have to buy and sell, and buy again. Although losses are not so crucial – still these trades are not profitable either. On chart #1 we have a mostly trending market with short periods of consolidation and whipsaw losses. But you can’t know it ahead of time! What if market will be mostly a ranging market, rather than trending market?
As usual, before jumping aboard, you should estimate where you will place your stop loss order and apply strict rules of money management that allow you to stay in trading despite consecutive losses.
Pipruit: I see. Also, I have to estimate what periods to apply to the MAs first…
Commander in Pips: Absolutely. As you understand this strategy theoretically assumes that you have a position every time. When MAs cross each other, you just shift position to the opposite, but not totally close the previously opened one. You can apply stop loss orders additionally to each position. Let’s make some conclusion about this strategy:
1. This strategy will give you excellent results on a volatile and trending market, where periods of consolidation are not so long-term. Like on our chart;
2. If market is ranging during most of the trading time – more probable it is that this strategy will give you much shallower results, or even a net loss;
3. This tells us, that you can catch a lot of painful crossovers before you really will be able to ride the trend.
4. This strategy demands many tools such as – applying of stop loss, additional filters for entering into trades, some signal confirmations and other tools, that allow you to reduce losses and filter out whipsaw action, at least partially. Also this strategy demands preliminary investigation of different pairs to choose historically the most trending from them, and optimization of the MAs periods that will work best.
Comments

Hamza Samiullah
6 years ago,
Registered user
Good strategy...
I
islandboy
5 years ago,
Registered user
good day can I use the displacement SMA to make these crosses??
O
One-fm
5 years ago,
Registered user
insightful
Table of Contents
- Introduction
- FOREX - What is it ?
- Why FOREX?
- The structure of the FOREX market
- Trading sessions
- Where does the money come from in FOREX?
- Different types of market analysis
- Chart types
- Support and Resistance
- Candlesticks – what are they?
- Mysterious Fibonacci
- Introduction to Moving Averages
- Bollinger Bands
- Leading and Lagging Indicators
- Basic chart patterns
- Pivot points – description and calculation
- Elliot Wave Theory
- Intro to Harmonic Patterns
- Divergence Intro
- Harmonic Approach to Recognizing a Trend Day
- Intro to Breakouts and Fakeouts
- Again about Fundamental Analysis
- Cross Pair – What the Beast is That?
- Multiple Time Frame Intro
- Market Sentiment and COT report
- Dealing with the News
- Let's Start with Carry
- Let’s Meet with Dollar Index
- Intermarket Analysis - Commodities
- Trading Plan Framework – Common Thoughts
- A Bit More About Personality
- Mechanical Trading System Intro
- Tracking Your Performance
- Risk Management Framework
- A Bit More About Leverage
- Why Do We Need Stop-Loss Orders?
- Scaling of Position
- Intramarket Correlations
- Some Talk About Brokers
- Forex Scam - Money Managers
- Graduation!